
United Continental Holdings Inc.’s (NYSE:UAL) second-quarter 2017 earnings (on an adjusted basis) of $2.75 per share beat the Zacks Consensus Estimate by 3 cents.
Moreover, the bottom line improved 5.36% on a year-over-year basis on the back of a 6.43% operating revenue growth. Operating revenues of $10 billion in the second quarter were also marginally ahead of the Zacks Consensus Estimate of $9.964 billion.
In addition, the carrier reported an increase in passenger unit revenues in the quarter on a year-over-year basis. However, the third quarter forecast for the metric disappointed investors. Consequently, the stock declined in after-market trading on Jul 18.
Operating Results
Consolidated passenger revenue per available seat mile (PRASM or unit revenues) improved 2.1% year over year to 12.78 cents. Yield on a consolidated basis grew 2% from the second quarter of 2016, while passenger revenues increased 6.4% to $8,622 million. Cargo revenues increased 22.1% and other revenues improved 3.6% in the same time frame.
During the reported quarter, airline traffic measured in revenue passenger miles, improved 4.3% year over year on a consolidated basis. Capacity (or available seat miles) grew 4.2%. Load factor (percentage of seats filled with passengers) was flat at 83.5%, as capacity expansion was roughly identical to traffic growth. Average fuel price per gallon (on a consolidated basis), excluding hedge losses, increased 15.6% year over year to $1.63.
Total operating expenses, excluding special items, grew 8.3% year over year to $8.6 billion. Consolidated unit cost or cost per available seat mile (CASM) – excluding fuel, third-party business expenses and profit sharing – increased 3.1% year over year, primarily owing to the labor deals inked by the company. The quarter saw the carrier buying back $0.4 billion of its common stock at $74.39 per share (average price) as well.
Liquidity
United Continental exited the second quarter with $6.6 billion in unrestricted liquidity, which included $2 billion of undrawn commitments under its revolving credit facility. In fact, this Zacks Rank #1 (Strong Buy) company generated $1.6 billion in operating cash flow in the quarter under review. Free cash flow at the end of the quarter was $314 million. You can see the complete list of today’s Zacks #1 Rank stocks here.
United Continental Holdings, Inc. Price, Consensus and EPS Surprise
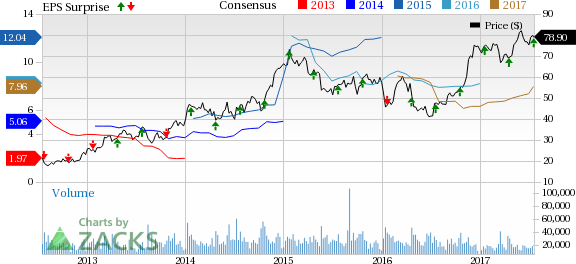
United Continental Holdings, Inc. Price, Consensus and EPS Surprise | United Continental Holdings, Inc. Quote
Fleet Upgrade Efforts
United Continental is making constant efforts to modernize its fleet. To this end, the company bolstered its fleet by taking delivery of six Boeing (NYSE:BA) 777-300ER aircraft, one used Airbus A319 aircraft and 10 Embraer E175 aircraft in the reported quarter. Next year, it intends to take delivery of four more Boeing 777-300ER planes.
The carrier also said that it has pushed back taking delivery of four Airbus A350 planes from 2018. It intends to expedite its order of 12 Boeing 737 Max planes and two Boeing 787-10 aircraft in 2019.
Third-Quarter Guidance
United Continental expects consolidated PRASM in the band of -1% to +1% (year over year) in the third quarter. Consolidated capacity, which increased 4.2% in the reported quarter, is projected to climb approximately 4% in the third quarter. The company expects pre-tax margin (adjusted) in the range of 12.5%–14.5%. In addition, unit costs (excluding Fuel, Profit Sharing & Third Party business costs) are anticipated to increase in the band of 2% to 3% owing to higher labor costs. Average fuel price per gallon (consolidated) is projected in $1.56 to $1.61 range.
Other Important Releases Coming Up
Investors interested in the airline space will now keenly await the second-quarter earnings reports from likes of Hawaiian Holdings Inc. (NASDAQ:HA) and JetBlue Airways Corp. (NASDAQ:JBLU) on Jul 25, and Southwest Airlines (NYSE:LUV) on Jul 27.
Looking for Stocks with Skyrocketing Upside?
Zacks has just released a Special Report on the booming investment opportunities of legal marijuana.
Ignited by new referendums and legislation, this industry is expected to blast from an already robust $6.7 billion to $20.2 billion in 2021. Early investors stand to make a killing, but you have to be ready to act and know just where to look. See the pot trades we're targeting>>
Southwest Airlines Company (LUV): Free Stock Analysis Report
JetBlue Airways Corporation (JBLU): Free Stock Analysis Report
United Continental Holdings, Inc. (UAL): Free Stock Analysis Report
Hawaiian Holdings, Inc. (HA): Free Stock Analysis Report
Original post
Zacks Investment Research