The Chicago Fed's National Activity Index, which I reported on yesterday, is based on 85 economic indicators drawn from four broad categories of data:
- Production and Income
- Employment, Unemployment and Hours
- Personal Consumption and Housing
- Sales, Orders, and Inventories
The complete list is available here in PDF format.
In yesterday's Chicago Fed update, we learned that two of the four broad categories of indicators that make up the index increased from August, and three of the four categories made positive contributions to the index in September -- Personal Consumption & Housing being the negative outlier. Let's now take a look at the historical context, focusing on the less volatile 3-month moving average of the components.
A chart overlay of the complete 45-year span of all four categories, even if we use the three-month moving averages, is a bit challenging for visual clarity: 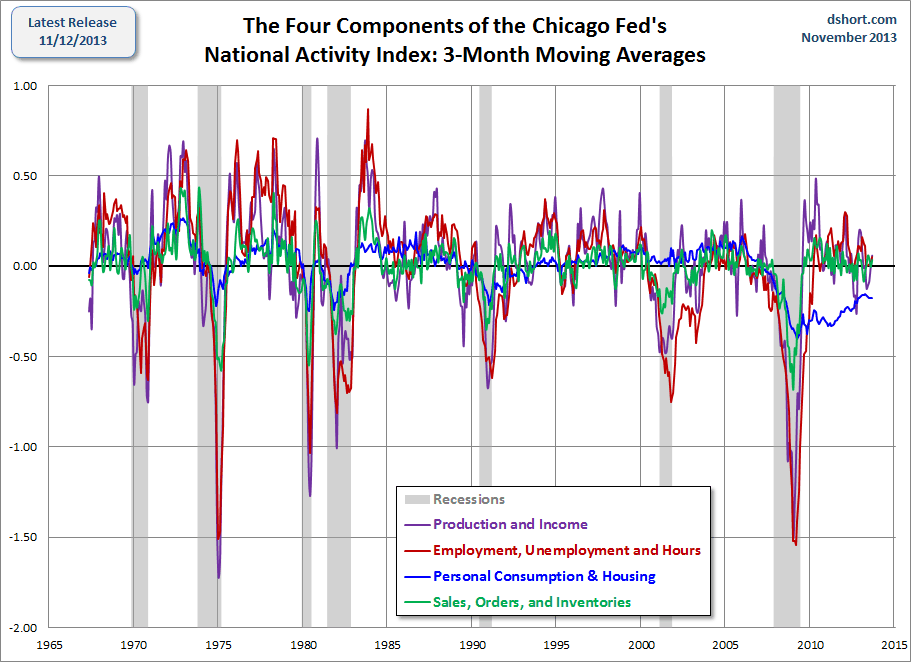
So here is a close-up view since 2000: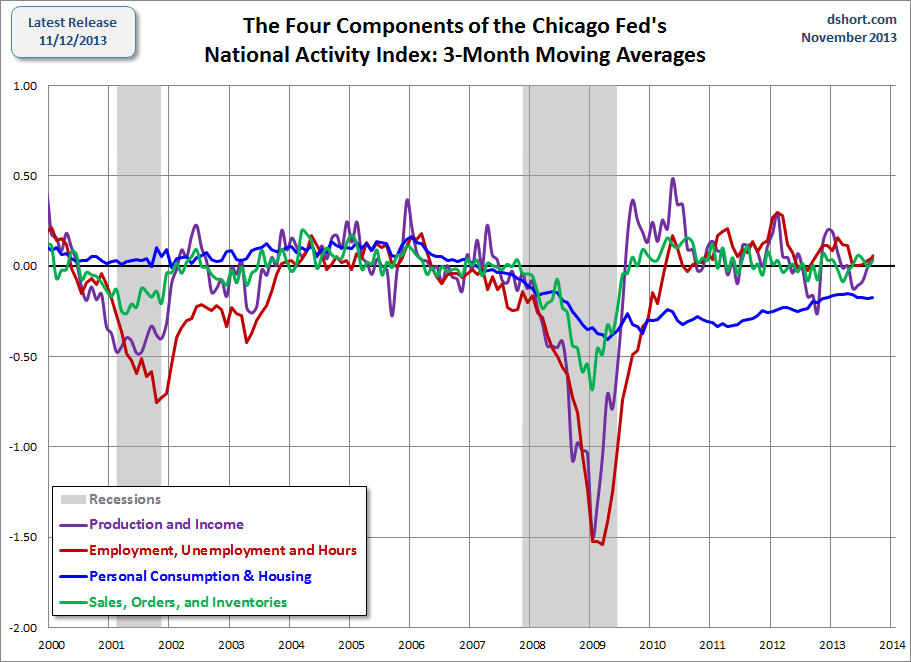
But a snapshot of the 21st century contains only two recessions, so it's unclear how the individual components have behaved in during the seven recessions since the 1967 starting point for this data series.
Here is a set of charts showing each of the four components since 1967. Because of the highly volatile nature of the data, the charts are based on three-month moving averages, a smoothing strategy favored by the Chicago Fed economists. I've also highlighted the values for the months that the NBER subsequently identified as recession starts.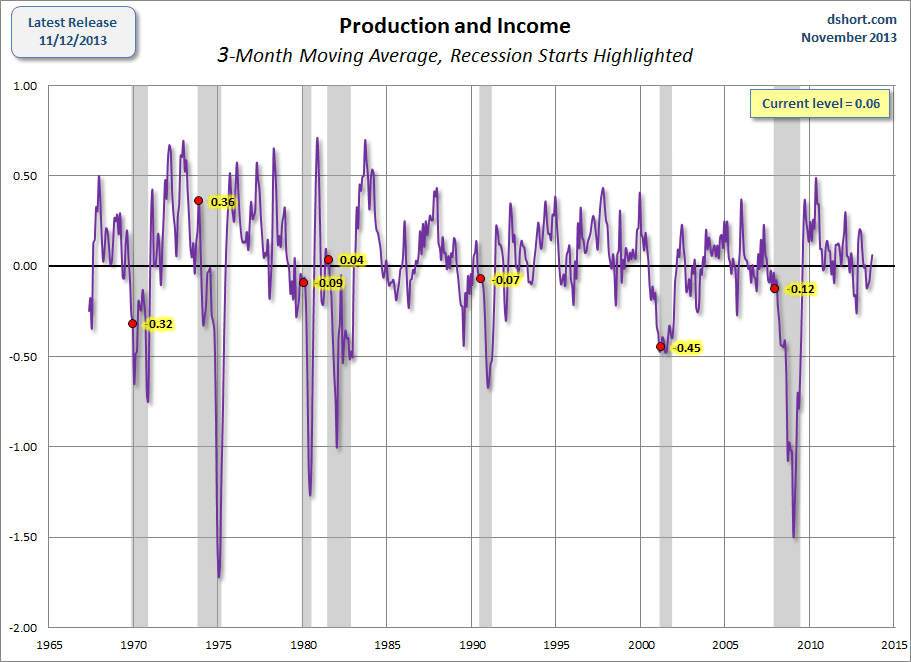
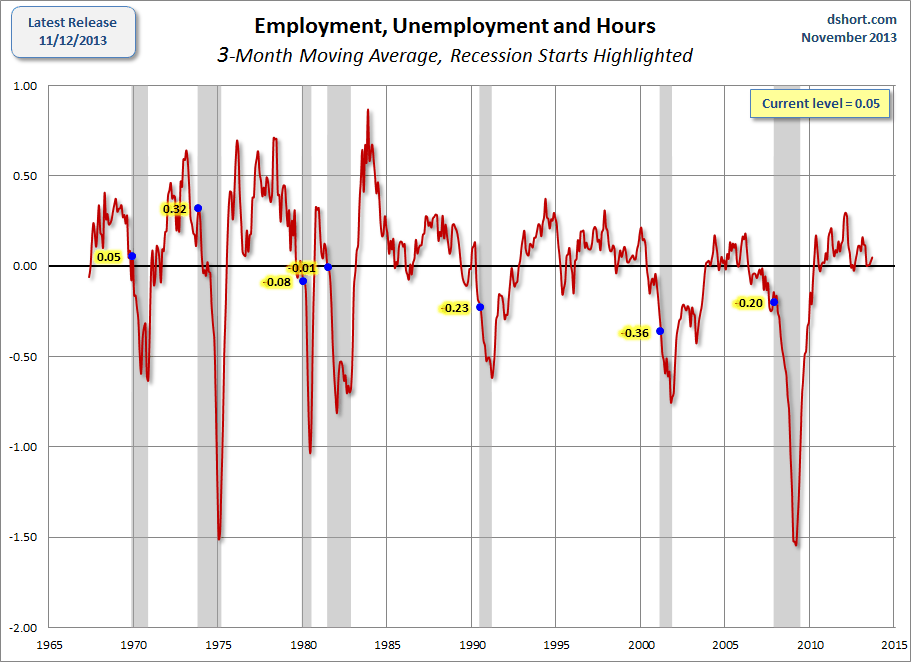
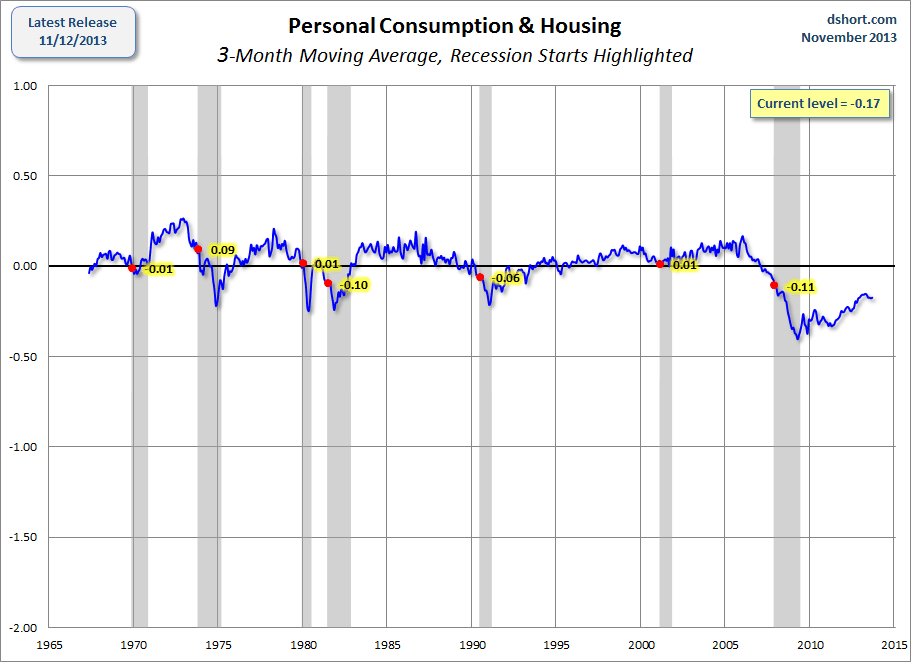
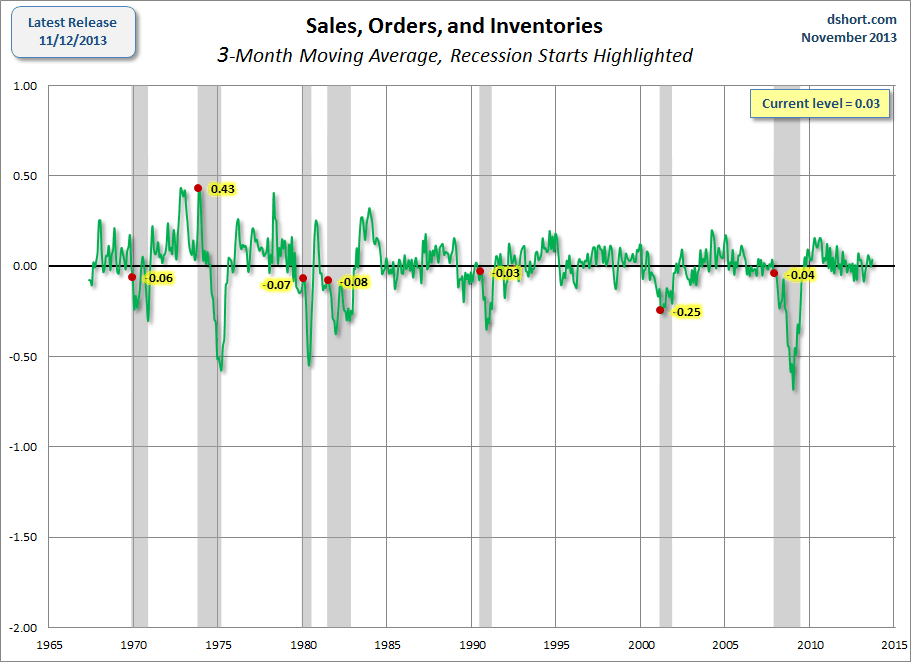
There's a lot to digest in the individual charts. Clearly the first two (production and income and employment and unemployment, and hours) are the more volatile of the quartet. It is also obvious that personal consumption and housing has been the biggest drag since the onset of the Great Recession. In fact, if I use the Excel default vertical axis (optimized for the data) rather than using the same vertical scale for all four components, the sustained lethargy of this CFNAI component is quite dramatic. We can readily see that it's the clear outlier in the quartet. The good news is that the trend has generally been on the mend, although it's now off its interim high set in April.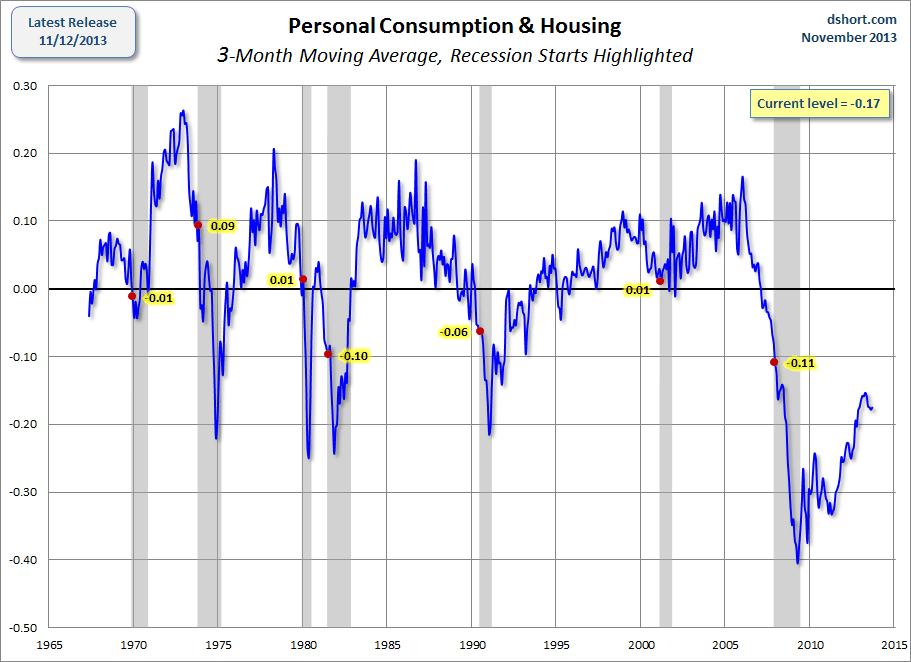
I'll close this dissection of the CFNAI components by reassembling them for a closer look at their collective 3-month moving averages since 2007.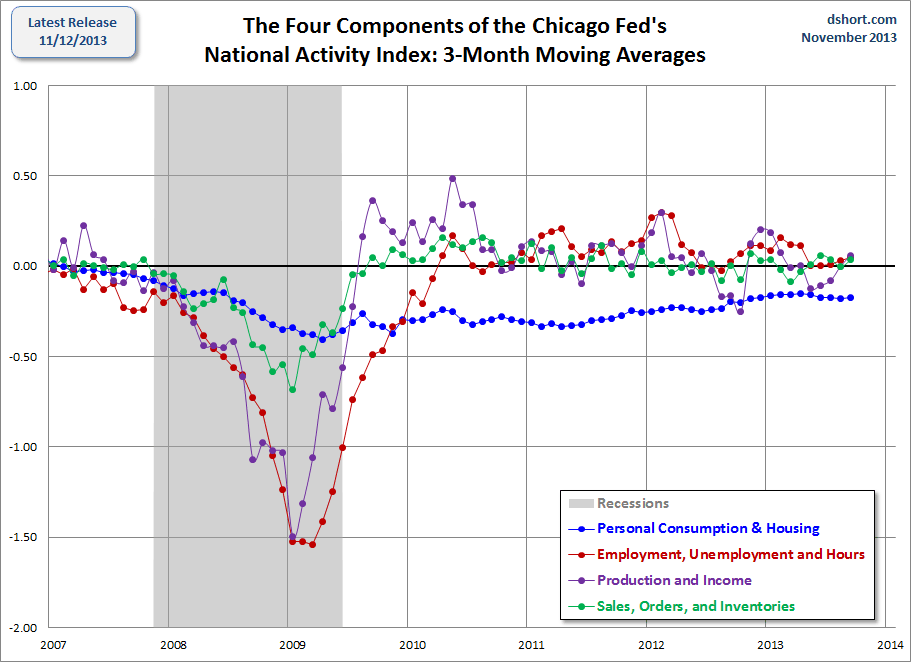
Check back next month for a close-up look at the latest trend directions.
