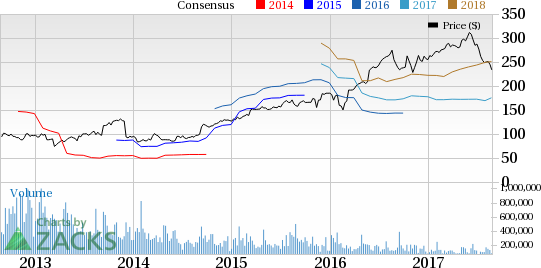
Ulta Beauty, Inc. (NASDAQ:ULTA) , which has been delivering positive earnings and sales surprises consistently for over three years, kept its robust trend alive in second-quarter fiscal 2017 as well. Both the top line and the bottom line topped the Zacks Consensus mark, alongside improving year over year. The sturdy quarter also called for a perked-up guidance for fiscal 2017. Clearly, the company continues to stand out, as it is one of the very few retailers to perform well even amid stiff competition from online giants like Amazon.com Inc. (NASDAQ:AMZN) .
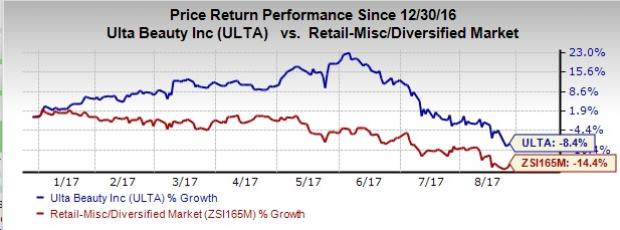
But, all is not well for Ulta Beauty. Shares of this cosmetics retailer lost 5.6% in the after-market trading session on Aug 24 despite the stellar results. Though the top line came ahead of estimates, the beat was very marginal. Also, the rate of comparable store sales (comps) growth decelerated from the year-ago period. While management’s outlook for the third quarter was somewhat in sync with analysts’ expectations, it looks like investors were expecting a more encouraging forecast. Well, these could be the possible reasons behind the downward bend of the stock, which otherwise looks fundamentally sound. Following yesterday’s performance, Ulta Beauty has declined 8.4% year to date. However, it fared better than the industry’s 14.4% plunge.
Results in the second quarter were fueled by market share gains and benefits from compelling offers through the company’s impressive loyalty program. Further, results were driven by growth across all product categories, where prestige cosmetics continued to outperform. Also, strong marketing initiatives, outstanding e-Commerce improvement and continued progress at the company’s salon operations drove results.
Solid Q2 Numbers
Coming to numbers, this Zacks Rank #3 (Hold) company posted adjusted earnings of $1.83 per share, surpassing the Zacks Consensus Estimate of $1.73 and soared 27.9% year over year. This included a favorable impact of 2 cents from the adoption of a new accounting standard in the fiscal 2017 beginning.
Net sales advanced 20.6% year over year to $1,289.9 million, marginally exceeding the Zacks Consensus Estimate of $1,287.8 million. The upside was driven by solid comps and productivity from new stores.
Comps (including stores and e-Commerce) improved 11.7%, compared with 14.4% growth in the prior-year quarter. Comps growth came on the back of favorable traffic and ticket, along with store growth and stupendous e-Commerce improvement. During the quarter, the company registered transaction growth of 5.5% while average ticket was up 6.2%.
Overall, retail business (comprising retail and salon) witnessed comps growth of 8.4%, including 7.7% improvement for salon. Retail comps growth was driven by 3.4% improvement in traffic and 5% rise in ticket. Ticket growth was aided by higher average selling price. In the salon business, improvement in comps was mainly backed by ticket growth.
Sales for the salon business increased 15.3% to $68.0 million. Additionally, Ulta Beauty witnessed whopping 72.3% growth in e-Commerce sales to $96.3 million in the quarter. This reflects about 340 bps of the total comps growth recorded in the quarter.
Gross profit grew roughly 22% year over year to $469.3 million. Further, the gross profit margin expanded 40 bps to 36.4%, attributable to improved merchandise margins and lower fixed store expenses.
Operating income advanced 25.1% year over year to $179.8 million, while operating margin improved 50 bps to 14.0%. The expansion in operating margin is attributed to a 10 bps decline in SG&A expenses as a percentage of sales, along with the rise in gross margin. Preopening expenses, on the other hand, escalated 29.8% to $6.1 million.
Other Financials
Ulta Beauty ended the quarter with cash and cash equivalents of $92.9 million, short-term investments of $180 million and shareholders’ equity of $1,635.4 million. Merchandise inventories totaled $1,144.7 million, marking an increase of 23.1% from the year-ago period. Average inventory per store increased 10.5%.
Net cash provided by operating activities came in at roughly $220 million in the first half of fiscal 2017.
During the quarter, the company bought back 462,421 shares for a total of $126.5 million. On a year-to-date basis, the company bought back 647,088 shares for $178.1 million. As of Jul 29, 2017, the company had about $268.1 million worth of authorization remaining under the $425 million buyback plan approved in Mar 2017.
Store Updates
In the first half of the fiscal, the company opened 38 new stores, while it relocated and remodeled three and five stores, respectively. With this, the company operated 1,010 stores, as of the end of the second quarter, while increasing its total square footage by 11.3% year over year.
In fiscal 2017, the company plans to open 100 net new stores, remodel 11 stores and relocate 7 outlets. This includes 50 store openings planned for the third quarter.
Guidance
Following an excellent quarter, Ulta Beauty raised its comps and earnings outlook for fiscal 2017. The company now expects to deliver comps growth (including e-Commerce) in the range of 10-11%, up from the old projection of 9-11%.
Further, the company upgraded its fiscal 2017 e-Commerce sales growth forecast to a range of 50-60%, from around 50% expected earlier. Consequently, management now envisions earnings per share growth to come in a high twenties percentage range up from mid-twenties percentage band guided previously.
Earnings per share forecast for fiscal 2017 includes the impact of the additional 53rd week; nearly $350 million impact from share repurchases and the effect of tax rate benefit realized so far this year. However, the company will exclude all tax-related impacts from the adoption of the new accounting standard for the rest of fiscal 2017.
Apart from this, Ulta Beauty expects to spend about $460 million toward capital expenditures in the fiscal, of which about $80 million will be used to fund the expansion of prestige brand.
For fiscal third quarter, the company anticipates net sales in a range of $1,331-$1,353 million, compared with $1,131.2 million delivered in the prior-year quarter. The current Zacks Consensus Estimate is pegged at $1.33 billion. Comps are expected to grow in the range of 9-11% compared with 16.7% increase registered in third-quarter fiscal 2016. Moreover, e-Commerce sales are projected to surge around 50%.
Earnings per share for the third quarter are expected in the range of $1.63-$1.68, compared with $1.40 earned in third-quarter fiscal 2016. The current Zacks Consensus Estimate for the third quarter is pegged at $1.67.
Interested in Retail? 3 Picks You Can’t Miss
Big Lots Inc. (NYSE:BIG) , with long-term EPS growth rate of 13.5% and a solid earnings surprise history carries a Zacks Rank #2 (Buy). You can see the complete list of today’s Zacks #1 Rank (Strong Buy) stocks here.
Burlington Stores Inc. (NYSE:BURL) also with a Zacks Rank #2, has long-term growth rate of 15.9%.
Build-A-Bear Workshop, Inc. (NYSE:BBW) is another solid bet with a long-term earnings growth rate of 22.5%, currently flaunts a Zacks Rank #2.
4 Surprising Tech Stocks to Keep an Eye On
Tech stocks have been a major force behind the market’s record highs, but picking the best ones to buy can be tough. There’s a simple way to invest in the success of the entire sector. Zacks has just released a Special Report revealing one thing tech companies literally cannot function without. More importantly, it reveals 4 top stocks set to skyrocket on increasing demand for these devices. I encourage you to get the report now – before the next wave of innovations really takes off.
Amazon.com, Inc. (AMZN): Free Stock Analysis Report
Big Lots, Inc. (BIG): Free Stock Analysis Report
Burlington Stores, Inc. (BURL): Free Stock Analysis Report
Ulta Beauty Inc. (ULTA): Free Stock Analysis Report
Build-A-Bear Workshop, Inc. (BBW): Free Stock Analysis Report
Original post
Zacks Investment Research

