Ulta Beauty Inc (NASDAQ:ULTA)
When Ulta Beauty reported their first quarterly earnings on May 25, 2017 not only did they beat analysts estimates but they also raised their forward-looking earnings guidance. This created a frenzy for the shares in the after market trading session.
The shares which have traded in a 52-week range from $206.61 to a high of $301.40 were up on the day a good amount, + $12.53 which is 4.47%. However, in the aftermarket they continued the surge, going up an additional $11.46 which is 3.91% and closed at $304.50 a new 52-week and all-time high.
The company has a huge presence in the United States, with their products being displayed and sold in over 70,000 places ranging from drugstores to supermarkets to free-standing corporate mega stores. And the company has a program called a “loyalty program” which entices customers to keep returning on a regular basis.
Ulta Beauty Earnings
Earnings came in at $1.91 per share which beat estimates of $1.79 per share. Revenues were $1.31 billion dollars compared with estimates of at $1.28 billion. One of the biggest drivers to the growth in earnings came from their internet and e-commerce operations. In the internet arena sales were up 71% alone.
Corporate Comments
CEO Mary Dillon had this to say to analysts and investors,
“The Ulta Beauty team kicked off 2017 with excellent performance in the first quarter, Strong execution of our growth strategies delivered above plan sales and earnings growth. Our results reflect continued newness and innovation in merchandising, successful marketing programs, steady progress in our salon business and exceptional growth in e-commerce.” –BusinessWire
ULTA Technicals

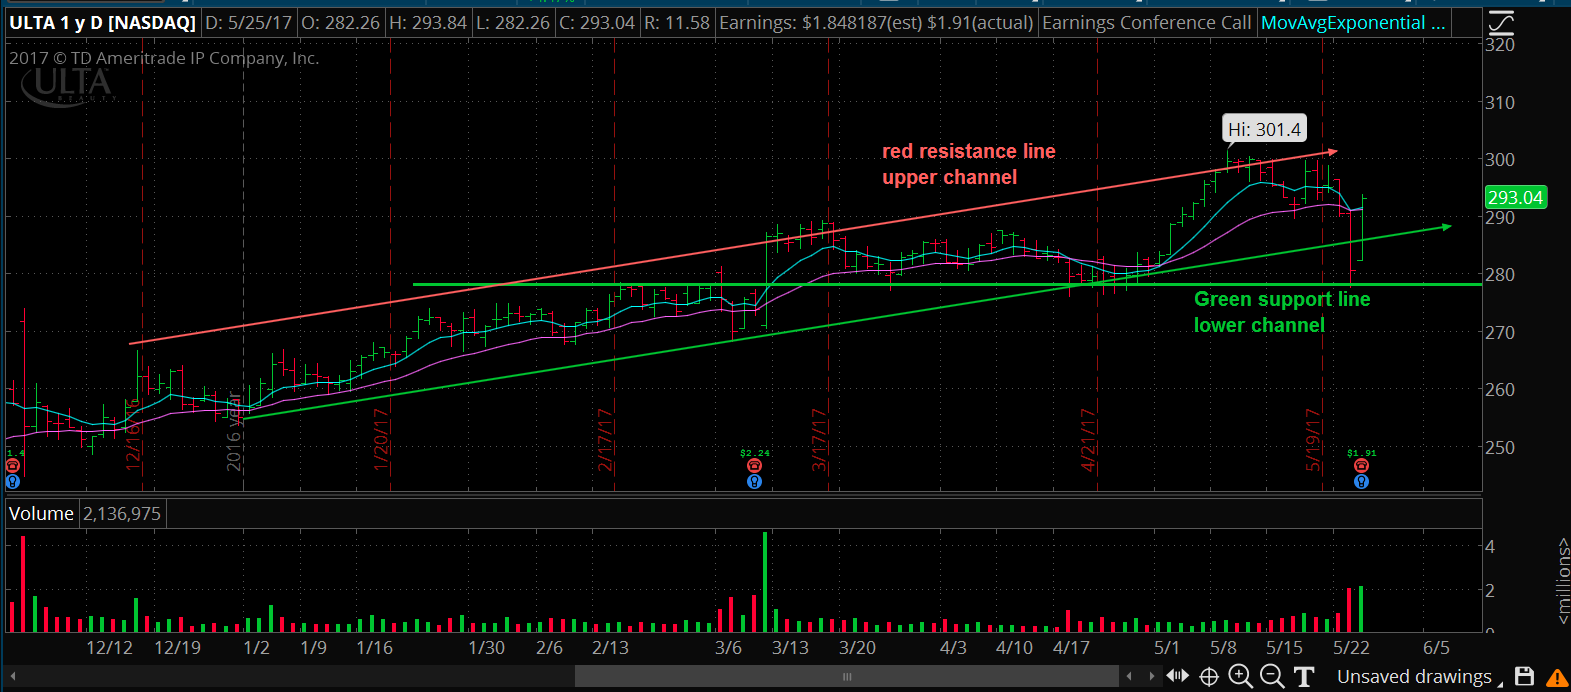
Ulta Beauty Chart
The chart above is the price action going back to the beginning of 2017. The reader can see that the price has stayed within the upper red Channel and lower green Channel trend line.
 Ulta Beauty Chart
The above price chart shows the intraday move on Thursday and the subsequent after-hours price move in the shaded area to the right.
It is moves like this in the aftermarket that will catch many investors and traders attention when shares open on the NASDAQ Stock exchange for trading on Friday morning. We will want to make sure that relative volume is going to be at least 2 times average volume and if prices can hold the VWAP.
Company Profile
Ulta Beauty, Inc. is a holding company for the Ulta Beauty group of companies. The Company is a beauty retailer. The Company offers cosmetics, fragrance, skin, hair care products and salon services. The Company offers approximately 20,000 products from over 500 beauty brands across all categories, including the Company’s own private label. The Company also offers a full-service salon in every store featuring hair, skin and brow services.
The Company operates approximately 970 retail stores across over 48 states and the District of Columbia and also distributes its products through its Website, which includes a collection of tips, tutorials and social content. The Company offers makeup products, such as foundation, face powder, concealer, color correcting, face primer, blush, bronzer, contouring, highlighter, setting spray, shampoos, conditioners, hair styling products, hair styling tools and perfumes. The Company also offers makeup brushes and tools, and makeup bags and cases
