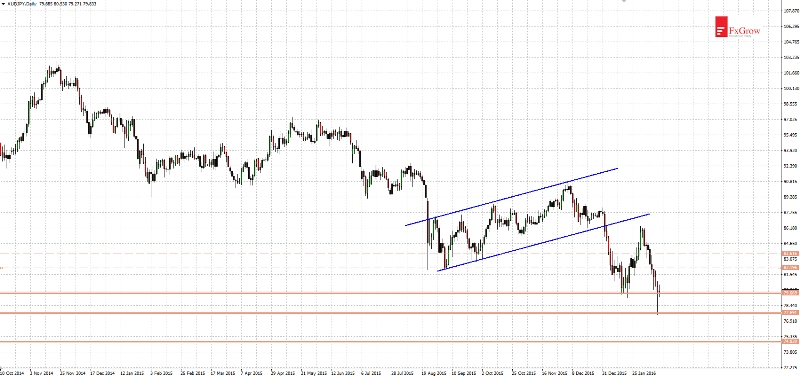
USD/JPY - After 9 days of declines there is a hope for a rebound
Previous AUD/JPY analysis was very profitable. I indicated flag pattern and direction of breakout. I wrote: 'Flag is a pattern of trend continuation which means that price should break below lower limit of the flag according to a main downtrend'. As you can see breakout occurred and price sharply moved down. After rebound, since mid-January decline continues and yesterday price tested support at 77.60.
Right now rebound should also occur - in last 9 days price declined without one day of stronger break. Yesterday's daily candle with long bottom shadow gives a hope that rebound will start right now. Nearest supports are at 79.60, 77.70, 74.80. Nearest resistances are located at 82.20, 83.60, 84.70, 85.60.
Time frame D1
Note: This analysis is intended to provide general information and does not constitute the provision of INVESTMENT ADVICE. Investors should, before acting on this information, consider the appropriateness of this information having regard to their personal objectives, financial situation or needs. We recommend investors obtain investment advice specific to their situation before making any financial investment decision.
