Investing.com’s stocks of the week
Headquartered in New York, Ubiquiti Networks Inc (NASDAQ:UI) is a communication equipment manufacturer with a market cap of ~$13 billion. The stock is up 85% since its late-August low and is now trading in the vicinity of $200 a share.
Understandably, such sharp and fast rallies easily attract people’s attention. Extrapolation of the past into the future is the most common type of “analysis” inexperienced investors perform. Unfortunately, it is also the least sensible, because by the time there is a trend to extrapolate, there is not much left of it.
Is it safe for investors to rely on Ubiquiti ‘s uptrend to continue? The company is profitable and financially healthy, which is always a good thing. However, it was also profitable and financially healthy between April and August, when the share price plunged 39%. So let’s put UI stock’s price chart in Elliott Wave context and see if a similar outcome can be expected.

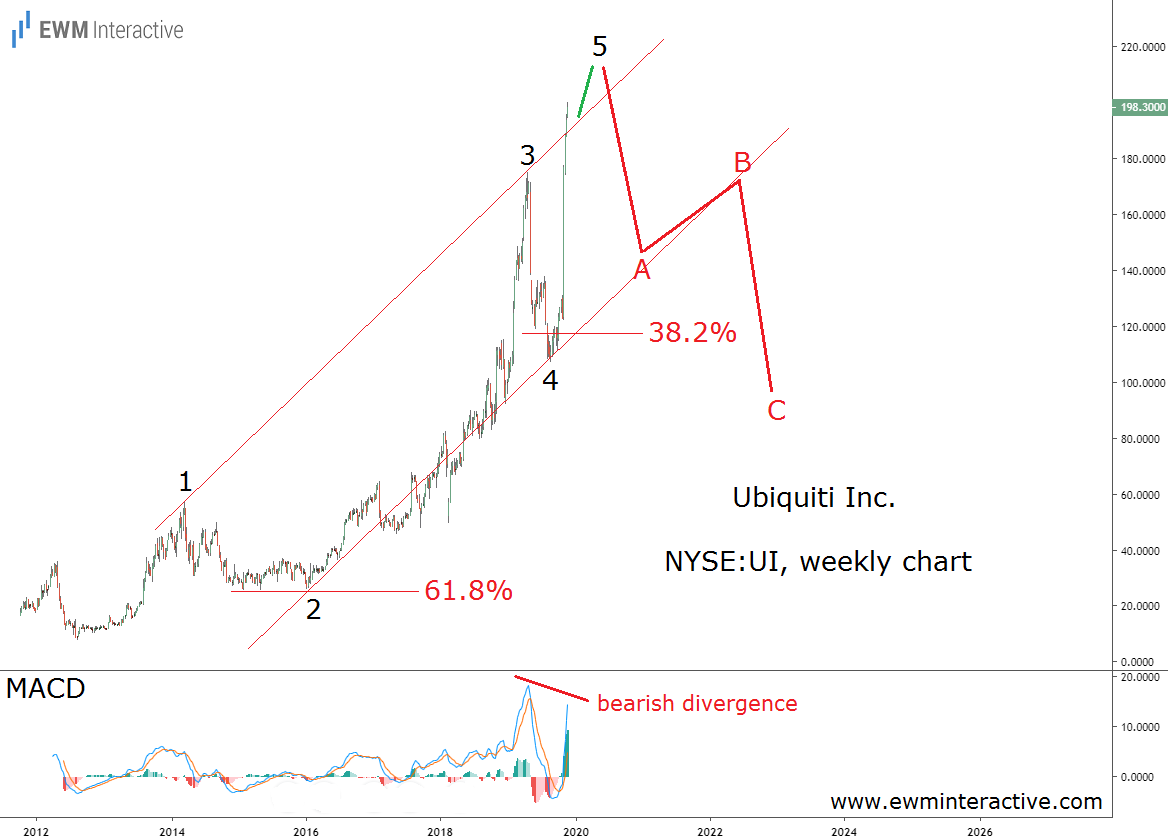
Ubiquiti ‘s weekly chart reveals the stock’s entire progress from $7.80 in August 2012. The first step was a recovery to $56.85 in wave 1, followed by a decline in wave 2 to precisely the 61.8% Fibonacci level. As it often happens, wave 3 was a wonder to behold. It was much bigger than wave 1 and took the price up to $174.95 by April 2019.
The following decline to $107.22 by August 2019 was wave 4. It ended shortly after entering the support area formed by the 38.2% Fibonacci level and the lower line of the trend channel. The analysis so far suggests the recent sharp surge must be the final fifth wave of the impulse pattern.
Trouble Lurks Ahead for Ubiquiti Shareholders
According to the Elliott Wave theory, a three-wave correction follows every impulse. The negative phase of the cycle usually erases all of the fifth wave’s gains. In Ubiquiti ‘s case, this means we can expect a decline to roughly $110 once wave 5 is over.
The MACD indicator supports the negative outlook with a bearish divergence between waves 3 and 5. If this count is correct, this is definitely not the time to join Ubiquiti bulls as the stock seems vulnerable to a ~50% selloff. The company’s P/E ratio of 41.5 also indicates the company is extremely overvalued right now.
