Who is Kevin Hassett? Wolfe looks at the Trump ally tipped to become Fed Chair.
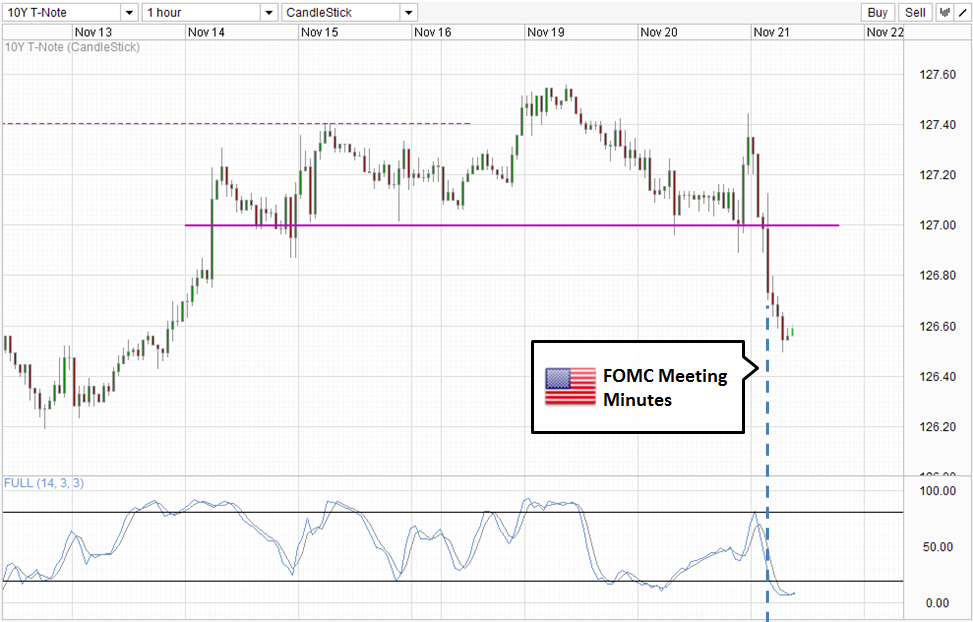
Yesterday was a tremendous win for the bears as the 10Y Treasury declined heavily following the release of the FOMC minutes. The minutes, from the October 29-30 meeting, reflected that voting members expect US economic data to show ongoing improvements in the labor market and "thus warrant trimming the pace of (QE) purchases in coming months".
The market interpreted this as a sign that a tapering action would come in early 2014, or perhaps even as early as December 2013, resulting in a huge sell-off in Treasuries that pushed 10Y prices to a low of 126.5 in the hours that followed.
Hourly Chart
Currently, price is trading mildly higher after rebounding from 126.5, which is also where the 10Y was post NFP lows two Fridays ago. Stochastic readings are also heavily oversold, favoring a bullish recovery in the near term. However, given the strong bearish sentiment surrounding 10Y prices, it is unlikely that prices will be able to retest 127.0—the closest significant resistance. Swing traders trading the rebound will need to be aware of the high risk of prices reverting back to the bear trend with little or no warning.
To appreciate how strong the bearish sentiment is, traders can simply look at price action during early US session which preceded the release of FOMC minutes. Prices did test 127.0 once again during the pre-market open following stronger than expected Retail Sales—with the market interpreting it as pro-tapering.
However, prices rebounded higher, off 127.0 subsequently due to both technical pressure and also partly from the weaker than expected Existing Home Sales figures. Note that he market wasn't expecting a hawkish FOMC minutes since Bernanke, Yellen and Evans were expressing dovish comments on Tuesday. There is simply no reason why prices should dip lower pre minutes, and successfully breaking and closing below 127.0 other than the strong underlying bearish sentiment that was and remains in play, and is likely to have strengthened thanks to the FOMC minutes.
Weekly Chart
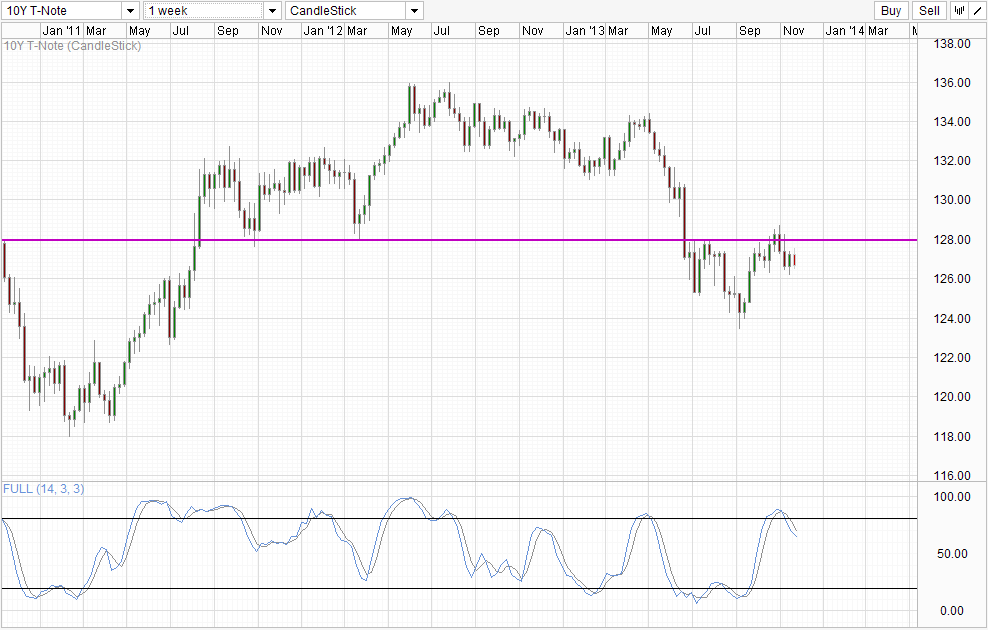
Long-term, the clear bearish narrative remains with China saying they are no longer increasing their FX reserves on top of holding a lower ratio of long-term Treasuries to maturities moving forward. China is slowly but surely moving away from using the USD, and we are going to lose a huge chunk of demand in US10Y, adding further bearish pressure to 10Y prices.
Technicals remain heavily bearish though under 128.0 with the Stochastic curve pointing lower at the early stages of a bearish cycle. However, 126.0 remains as a strong support and it is possible that prices may pull back slightly, especially given that a December Taper event is still elusive (the FOMC minutes only say 'in coming months', note the plural form). Therefore, speculators may have overextended themselves by thinking that a December tapering event is a go, which will result in some slight bullish response should the Fed not taper next month.
Original post