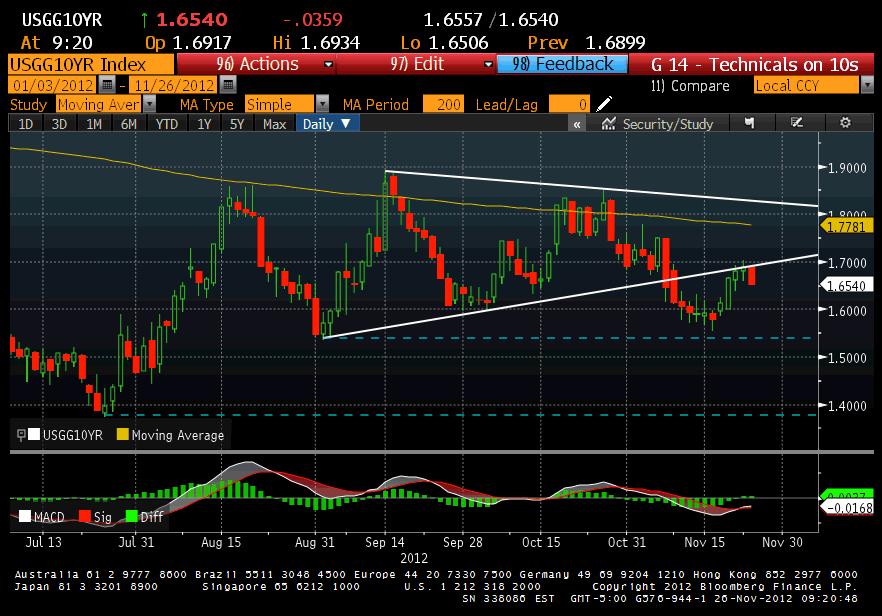
Despite accommodative monetary policy via QE3, yields on U.S. Treasuries remained range bound where buyers and sellers were indecisive on the direction of the market. However, with the latest weakness in risk assets as market watchers point to uncertainty surrounding the Fiscal Cliff, yields have broken below this sideways trend in a flight-to-quality bid and may challenge the recent lows.
As you can see in the chart below, with the yield falling 10 basis points to 1.65% on the day following the election, the 10-Year U.S. Treasury broke below the recent sideways trend. That break led to a rally where the yield reached to an intraday low of 1.55% on November 16 which is near the low set in late August. Since that probe lower, the benchmark note has retraced and sold off to the 50% retracement of the October-November rally and the former resistance of 1.69-1.70% which now acts as support in the sideways trend-line.
Given the action on Friday, support at 1.70% has held and it appears that buyers for the safe-haven asset have re-emerged to start the week with the 10-Year lower by 5bps. A sustained trade below that support line may lead to another test for the late August low. Hence, Treasury Bulls would target an 11bps drop to 1.54% with a Stop-Loss above 1.70%.
The current 10-Year pays a 1.625% Coupon Maturing on November 15, 2022 (CUSIP #912828TY8) and is trading at a dollar price of $99.77 which translates to a yield of 1.65% according to Trade Monster’s Bond Trading Center. In this bullish scenario, the price of the bond would appreciate to $100.77 or a gain of 1.1%. (As mentioned previously, an investor can own up to 10 times the amount of Treasuries for each amount of initial capital so performance can be amplified up to an equal amount. In addition, an investor can increase their exposure by using a bond with a greater duration such as the 30-Year Treasury or a U.S. Treasury Strip, aka Zero Coupon Treasuries.)
Furthermore, momentum below the August low would open the door for a retest of the all-time low of 1.38% set in late July.
Copper Divergence
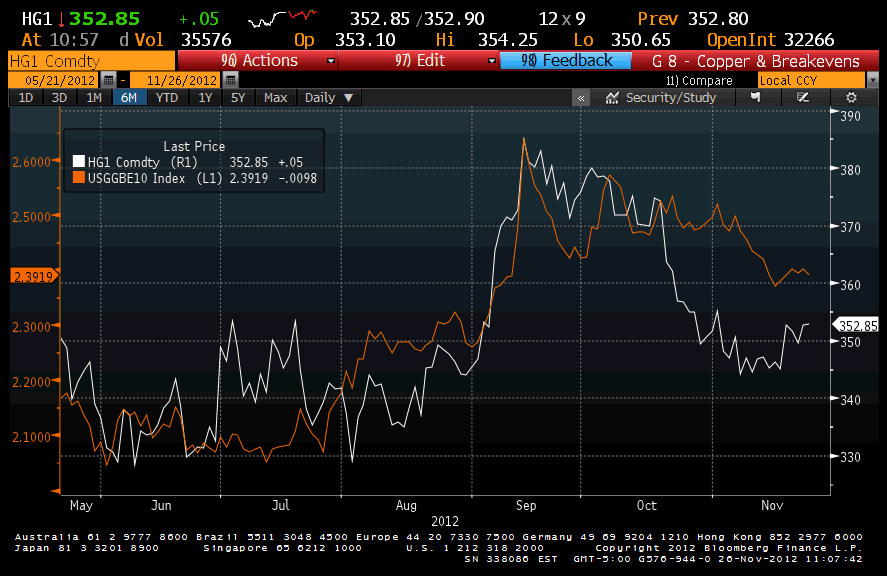
Another key indicator that is noteworthy is the divergence between inflation expectations and copper prices. Inflation expectations which are a key component of Treasury bond yields have diverged from copper prices recently. Inflation expectations aka “break-evens” which are defined as the yield differential between the 10-Year U.S. Treasury and the 10-Year TIPS (Treasury Inflation Protected Securities) have for the most part, remained lofty. Generally speaking, higher inflation means rising bond yields and vice-versa.
On the other hand, copper is often viewed as a leading indicator of economic growth. Falling copper prices suggest that demand for the base metal, which is used in many sectors of the economy, is declining. While far from being infallible, this in turn may mean slowing economic growth. De-accelerating economic growth typically suggests falling inflation expectations and thus lower bond yields.
As you can see in the chart below, the two indicators generally follow one another. That is, up until mid-October where the two key indicators diverged. According to Bloomberg, copper prices have collapsed close to 6% from the mid-October highs. During that time, inflation expectations have dropped just 10 basis points. If this relationship were to hold and the correlations were to re-align, these two indicators should converge.
Watch Inflation Expectations
Given the recent string of weak economic data around the globe such as many of the Purchasing Managers Indices falling below or staying near the threshold between contraction and growth, one would think that the fall in copper is justified. Hence, re-alignment between copper and inflation expectations may come with the latter dropping. Again, lower inflation expectations should lead to lower interest rates and add another tailwind to the backs of Treasury Bulls.
The other side of the coin is that a sustained trade above the aforementioned support level of 1.70% coupled with strength in risk assets, could push the yield higher. This in turn may lead to an opportunity for Treasury Bears and a reversal to a short position. The yield on the 10-Year Treasury would find support at the falling 200-day moving average of 1.77-1.78%. Buyers may emerge here but a break above that may lead to a test to 1.82%.
Disclaimer:
The above content is provided for educational and informational purposes only, does not constitute a recommendation to enter in any securities transactions or to engage in any of the investment strategies presented in such content, and does not represent the opinions of Bondsquawk or its employees.
- English (UK)
- English (India)
- English (Canada)
- English (Australia)
- English (South Africa)
- English (Philippines)
- English (Nigeria)
- Deutsch
- Español (España)
- Español (México)
- Français
- Italiano
- Nederlands
- Português (Portugal)
- Polski
- Português (Brasil)
- Русский
- Türkçe
- العربية
- Ελληνικά
- Svenska
- Suomi
- עברית
- 日本語
- 한국어
- 简体中文
- 繁體中文
- Bahasa Indonesia
- Bahasa Melayu
- ไทย
- Tiếng Việt
- हिंदी
U.S. Treasuries: Technicals On Tens
Latest comments
Loading next article…
Install Our App
Risk Disclosure: Trading in financial instruments and/or cryptocurrencies involves high risks including the risk of losing some, or all, of your investment amount, and may not be suitable for all investors. Prices of cryptocurrencies are extremely volatile and may be affected by external factors such as financial, regulatory or political events. Trading on margin increases the financial risks.
Before deciding to trade in financial instrument or cryptocurrencies you should be fully informed of the risks and costs associated with trading the financial markets, carefully consider your investment objectives, level of experience, and risk appetite, and seek professional advice where needed.
Fusion Media would like to remind you that the data contained in this website is not necessarily real-time nor accurate. The data and prices on the website are not necessarily provided by any market or exchange, but may be provided by market makers, and so prices may not be accurate and may differ from the actual price at any given market, meaning prices are indicative and not appropriate for trading purposes. Fusion Media and any provider of the data contained in this website will not accept liability for any loss or damage as a result of your trading, or your reliance on the information contained within this website.
It is prohibited to use, store, reproduce, display, modify, transmit or distribute the data contained in this website without the explicit prior written permission of Fusion Media and/or the data provider. All intellectual property rights are reserved by the providers and/or the exchange providing the data contained in this website.
Fusion Media may be compensated by the advertisers that appear on the website, based on your interaction with the advertisements or advertisers.
© 2007-2025 - Fusion Media Limited. All Rights Reserved.
