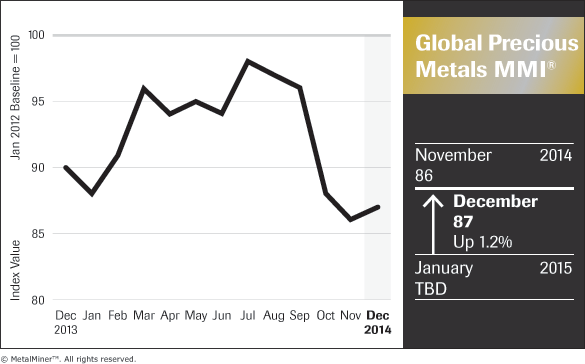
MetalMiner’s monthly Global Precious Metals MMI® hit 87 in December, bouncing back 1.2% from 86 in November – which happened to be an all-time low.
While US Palladium prices saw slight appreciation month over month – from $799 to $802 per ounce – the US gold bullion price played a big role in pushing our monthly precious metals index higher for the December reading.
What’s Behind It All?
MetalMiner Editor-at-large Stuart Burns runs it all down for us.
Gold bulls had their hopes boosted by two developments last weekend.
- Switzerland’s vote to hold 20% of the Swiss National Bank’s reserves in gold
- India’s surprise announcement on Friday that the country is removing the restriction on gold imports
However, neither the Swiss move nor the Indian step have fulfilled their hopes. According to Stuart:
Swiss voters voted against new rules that would have forced the Swiss National Bank to buy up to 1,500 metric tons of gold, some 50% of global annual production, over the next 5 years. India announced that it would withdraw the 80:20 scheme. Under it, importers were obliged to re-export 20% of all gold imported into India partly to slow imports but mostly to boost exports – both of which would reduce the net balance of trade drain that high gold imports are having on the economy there.
Short positions that had been unwound ahead of the Swiss vote are likely to now rebuild as the dollar continues to strengthen and the oil price continues to fall, so gold prices are expected to continue to trend downward. Currently at $1,175 an ounce, next year could see the price approach $1,000 ounce.
Don’t Call It a Comeback…Yet
But now, the US gold bullion price tracked by the IndX has bumped up, with political risk (rather than fundamentals) being the biggest driver. Since Switzerland and India didn’t help things, and China’s demand for gold and Silver slowing down, it’s up to investors’ sentiments. We’ll have to wait and see where the ride comes to a stop.
This Month’s Exact Prices
The price of Japanese Palladium bar jumped last month to $25.90 per gram. Japanese gold bullion reached $37.18 per gram after a 4.1% increase for the month. Japanese platinum bar finished the month at $38.48 per gram after gaining 3.3%. At $1,196, US gold bullion finished the month up 2.3% per ounce. US silver shifted up 1.4% last month to settle at $16.30 per ounce. After a 1.1% increase, Chinese palladium bar finished the month at $28.60 per gram. At $802.00 per ounce, the price of US palladium bar increased 0.4%.
A 8.1% drop over the past month left Chinese silver at $525.61 per kilogram. Japanese silver prices fell 3.9% to $4.76 per 10 grams after rising the previous month. The price of Chinese platinum bar drifted 2.3% lower to $40.94 per gram. Last month, Indian silver prices dropped by 1.8% to $603.01 per kilogram. The value of US platinum bar weakened by 1.1% this month, settling at $1,225 per ounce. Chinese gold bullion fell a slight 0.7% over the past month to $37.03 per gram. Indian gold bullion fell 0.2% to $424.39 per 10 grams.
The Global Precious Metals MMI® collects and weights 14 global precious metal price points to provide a unique view into precious metal price trends over a 30-day period. For more information on the Global Precious Metals MMI®, how it’s calculated or how your company can use the index, please drop us a note at: info (at) agmetalminer (dot) com.
by Taras Berezowsky
