⭐ Start off 2025 with a powerful boost to your portfolio: January’s freshest AI-picked stocksUnlock stocks

U.S. Dollar Index: One Final High Looks Likely

Published 11/13/2014, 04:00 AM
Updated 07/09/2023, 06:31 AM
EUR/USD
-
USD/JPY
-
AUD/NZD
-
DX
-

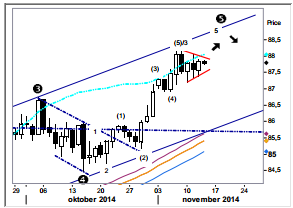
US Dollar Index: The fifth wave advance is certainly running late but given the fact that we seems to be creating a small bull triangle it is also fair to assume that there will be one more top to be put in place before it’s time to turn to the downside. Theoretically the top should be set at 89.94 but anything above 88.19 will fulfill the requirements for a top in place so caution urged as soon as trading at a fresh high. Breaking 87.36 and we’ve already turned the corner.

US Dollar Index Daily Chart

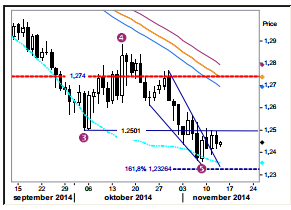
EUR/USD: Should soon continue higher. The exit from the fifth wave falling wedge (a terminating pattern) is expected to cause more short covering as prices are set to move higher. The best fitted hourly wave pattern calls for a minor setback to have been completed yesterday at 1.2419 and that the next step now should be a break of 1.2498 initiating the next move up to the mid 1.25’s. The correction case will turn obsolete if we pass the 1.2394 support.

EUR/USD Daily Chart

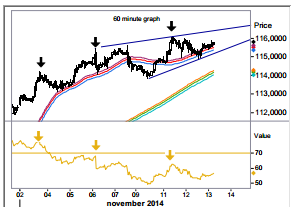
USD/JPY: Probably one more top. Compared to €/$’s already completed (and exited) falling wedge the rising one in $/JPY still seems to lack its final leg higher. A move above 116.11 will (ideally 116.45/55) will however complete the wedge which thereafter is seen being exited to the downside. A move lower will also be underpinned by the still growing RSI bear divergence.

AUD/NZD Daily Chart

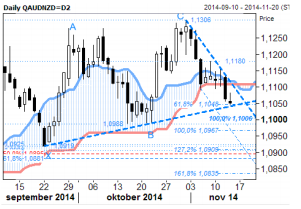
AUD/NZD: Below 1.1050 targets 1.1005/0965. Price action remains bearish and the thinned “Cloud” was convincingly broken yesterday. Trendline support at 1.1045 is a small hurdle, but once violated, extension should be penciled in towards the next target at 1.1005/1.0965 – not ruling out additional losses later. Local resistance seems to be building fast around 1.1095. Current intraday stretches are located at 1.1015 & 1.1125.

AUD/NZD Daily Chart

Original post

Latest comments

Loading next article…
Risk Disclosure: Trading in financial instruments and/or cryptocurrencies involves high risks including the risk of losing some, or all, of your investment amount, and may not be suitable for all investors. Prices of cryptocurrencies are extremely volatile and may be affected by external factors such as financial, regulatory or political events. Trading on margin increases the financial risks.
Before deciding to trade in financial instrument or cryptocurrencies you should be fully informed of the risks and costs associated with trading the financial markets, carefully consider your investment objectives, level of experience, and risk appetite, and seek professional advice where needed.
Fusion Media would like to remind you that the data contained in this website is not necessarily real-time nor accurate. The data and prices on the website are not necessarily provided by any market or exchange, but may be provided by market makers, and so prices may not be accurate and may differ from the actual price at any given market, meaning prices are indicative and not appropriate for trading purposes. Fusion Media and any provider of the data contained in this website will not accept liability for any loss or damage as a result of your trading, or your reliance on the information contained within this website.
It is prohibited to use, store, reproduce, display, modify, transmit or distribute the data contained in this website without the explicit prior written permission of Fusion Media and/or the data provider. All intellectual property rights are reserved by the providers and/or the exchange providing the data contained in this website.
Fusion Media may be compensated by the advertisers that appear on the website, based on your interaction with the advertisements or advertisers.
© 2007-2025 - Fusion Media Limited. All Rights Reserved.