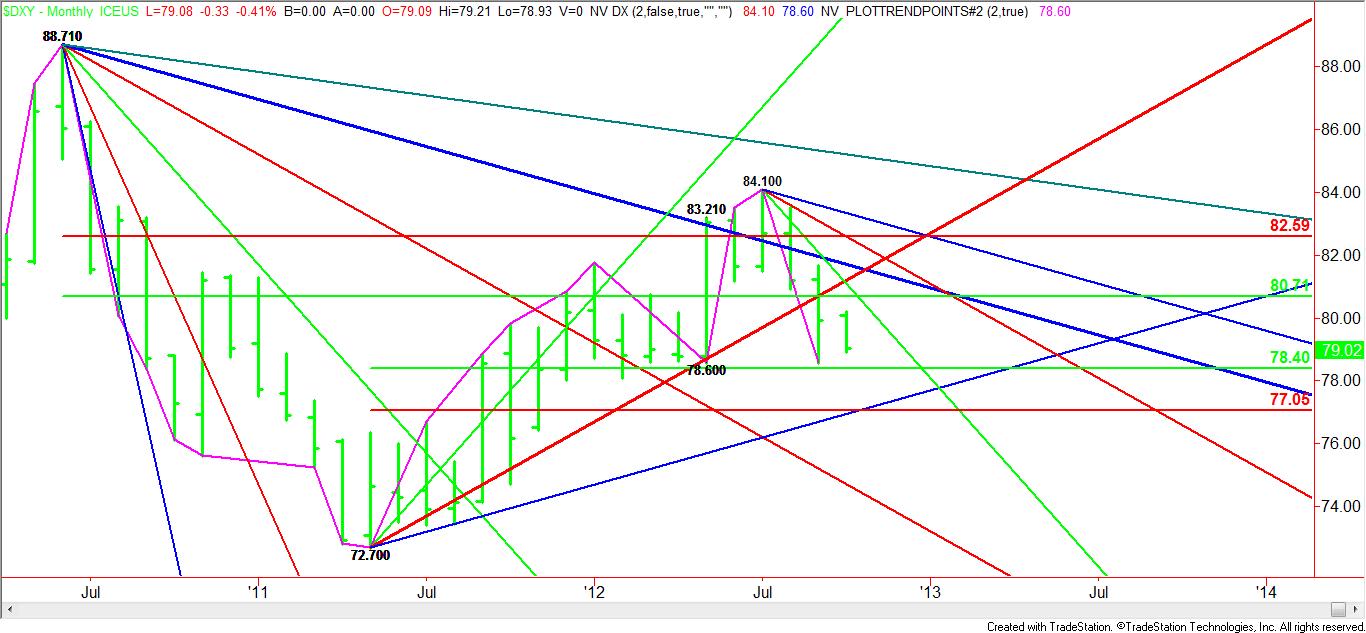
With ten days to go before the end of the month, the U.S. Dollar Index appears poised to finish lower and in a position to take out last month’s low at 78.600. A move through this low will also take out the May bottom while turning the main trend to down on the monthly chart.
Based on the May 2011 bottom at 72.700 and the July 2012 top at 80.710, a retracement zone was formed at 78.400 to 77.050. The upper boundary or 50% level essentially stopped the market as it neared 78.400, but this time the selling momentum seems to be too strong to stop it from dropping all the way to the Fibonacci level at 77.050.

An uptrending Gann angle comes in at 76.950 also this month, making 77.050 to 76.950 a logical downside target. Guiding the market lower this month is a downtrending Gann angle at 81.100.
The longer-term range is 88.710 to 72.700. This range created a retracement zone at 80.74 to 82.59. Although the U.S. Dollar Index did spend some time on the bullish side of this retracement zone, it has since crossed over to the bearish side, making the 50% level at 80.74 new resistance.
The U.S. Dollar Index topped out in July 2012 at 84.100 after European Central Bank President Mario Draghi vowed to do “whatever it takes” to preserve the euro. It took an additional hit in August when it became clear that the Fed would have to implement additional stimulus. Following Bernanke’s announcement of an infinite amount of stimulus, the Dollar Index plunged sharply in September.
The catalyst behind the current weakness is the possibility of Spain finally making a formal request for financial aid from the European Union. If the official request is made before the end of the month, look for the Dollar Index to take out the main bottom at 78.600, the 50% level at 78.400 and perhaps test the Fibonacci level at 77.050.
Based on the May 2011 bottom at 72.700 and the July 2012 top at 80.710, a retracement zone was formed at 78.400 to 77.050. The upper boundary or 50% level essentially stopped the market as it neared 78.400, but this time the selling momentum seems to be too strong to stop it from dropping all the way to the Fibonacci level at 77.050.

An uptrending Gann angle comes in at 76.950 also this month, making 77.050 to 76.950 a logical downside target. Guiding the market lower this month is a downtrending Gann angle at 81.100.
The longer-term range is 88.710 to 72.700. This range created a retracement zone at 80.74 to 82.59. Although the U.S. Dollar Index did spend some time on the bullish side of this retracement zone, it has since crossed over to the bearish side, making the 50% level at 80.74 new resistance.
The U.S. Dollar Index topped out in July 2012 at 84.100 after European Central Bank President Mario Draghi vowed to do “whatever it takes” to preserve the euro. It took an additional hit in August when it became clear that the Fed would have to implement additional stimulus. Following Bernanke’s announcement of an infinite amount of stimulus, the Dollar Index plunged sharply in September.
The catalyst behind the current weakness is the possibility of Spain finally making a formal request for financial aid from the European Union. If the official request is made before the end of the month, look for the Dollar Index to take out the main bottom at 78.600, the 50% level at 78.400 and perhaps test the Fibonacci level at 77.050.
