Breaking News
Get 45% Off 0
🚨 Don’t miss your updated list of AI-picked stocks for this month
Pick Stocks with AI

Tyson Foods (TSN) Misses Q4 Earnings, Sales Estimates

By Zacks Investment ResearchStock MarketsNov 21, 2016 02:47AM ET
www.investing.com/analysis/tyson-foods-(tsn)-misses-q4-earnings,-sales-estimates-200165921
Tyson Foods (TSN) Misses Q4 Earnings, Sales Estimates
By Zacks Investment Research   |  Nov 21, 2016 02:47AM ET
Saved. See Saved Items.
This article has already been saved in your Saved Items
 
 
TSN
+0.57%
Add to/Remove from Watchlist
Add to Watchlist
Add Position

Position added successfully to:

Please name your holdings portfolio
 
SYY
+1.10%
Add to/Remove from Watchlist
Add to Watchlist
Add Position

Position added successfully to:

Please name your holdings portfolio
 
LCc1
-0.84%
Add to/Remove from Watchlist
Add to Watchlist
Add Position

Position added successfully to:

Please name your holdings portfolio
 
HRL
+0.88%
Add to/Remove from Watchlist
Add to Watchlist
Add Position

Position added successfully to:

Please name your holdings portfolio
 
SAFM
0.00%
Add to/Remove from Watchlist
Add to Watchlist
Add Position

Position added successfully to:

Please name your holdings portfolio
 

Tyson Foods, Inc. (NYSE:TSN) posted fourth-quarter fiscal 2016 results, wherein both earnings and revenues missed the Zacks Consensus Estimate.

In fiscal fourth-quarter, adjusted earnings of 96 cents per share missed the Zacks Consensus Estimate of $1.24 by 22.6% but improved 16% from the year-ago tally of 83 cents on higher margins.

Revenues and Margins

Net sales slipped 6.1% to $9.156 billion due to lower sales across most of the segments like chicken, beef, pork and prepared foods. Sales missed our expectation of $9.31 billion by 1.6%. Sales volume dipped 8.2%, while average sales price (ASP) went down 5.1%.

TYSON FOODS A Price, Consensus and EPS Surprise

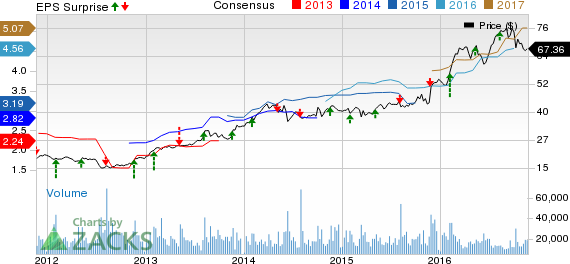
TYSON FOODS A Price, Consensus and EPS Surprise | TYSON FOODS A Quote

Tyson's adjusted operating income gained 3.2% to $586 million due to lower feed costs. Adjusted operating margin inflated 60 basis points (bps) to 6.4%.

Segment Details

Chicken: Sales at this segment remained almost flat year over year at $2.811 billion as a 3.2% dip in sales volume was offset by a 3.5% gain in average price. Sales volume declined due to the company’s strategy of optimizing its mix. Average sales price increased in third-quarter on positive mix.

Beef: Sales at this segment declined 15.1% year over year to $3.477 billion, due to 0.3% dip in sales volume along with a 14.9% decrease in ASP. ASP declined due to higher domestic availability of fed cattle supplies, while sales volume was hurt by reduction in live cattle processed.

Pork: Pork segment sales were up 1.4% year over year to $1.235 billion driven by a 0.4% increase in sales volume and a 1% rise in average price.

Prepared Foods: Sales at Prepared Foods slipped 1.5% year over year at $1.837 billion as 2.6% gain in volume was offset by 3.9% decline in ASP. Adjusted sales volume grew on higher demand.

Other: In the fiscal first quarter, the company’s International segment was shifted under ‘Other’ following the sale of Mexico and Brazil chicken operations in fiscal 2015. The Other segment also includes the foreign operations related to raising and processing live chickens in China and India as well as a third-party merger and integration costs.

Sales decreased to $96 million from $111 million in the year-ago quarter.

Fiscal Results

In fiscal 2016, adjusted earnings of $4.39 per share missed the Zacks Consensus Estimate of $4.66 and improved 39% from the year-ago tally of $3.15 on higher margins.

Net sales slipped 10.85% to $36.881 billion and missed our expectation of $37.05 billion.

Fiscal 2017 Guidance

The company issued fiscal 2017 guidance in concurrence with the earnings call. The company anticipates earnings to remain in the range of $4.7 to $4.85, up 7% to 10% year over year.

Zacks Rank

Tyson carries a Zacks Rank #3 (Hold).

Some better-ranked stocks in the broader consumer staple sector include Sanderson Farms Inc. (NASDAQ:SAFM) , Hormel Foods Corp. (NYSE:HRL) and Sysco Corp. (NYSE:SYY) .

Sanderson Farms sports a Zacks Rank #1 (Strong Buy) and has an expected earnings growth rate of 5%. You can see the complete list of today’s Zacks #1 Rank stocks here.

Hormel Foods carries a Zacks Rank #2 (Buy) and has an expected earnings growth rate of 9.6%.

Sysco also carries a Zacks Rank #2 and has an expected long-term earnings growth rate of 8.76%.

Zacks’ Best Private Investment Ideas

In addition to the recommendations that are available to the public on our website, how would you like to follow all Zacks' private buys and sells in real time?

Our experts cover all kinds of trades… from value to momentum . . . from stocks under $10 to ETF and option moves . . . from stocks that corporate insiders are buying up to companies that are about to report positive earnings surprises. You can even look inside exclusive portfolios that are normally closed to new investors. Starting today, for the next month, you can have unrestricted access. Click here for Zacks' private trades >>


SYSCO CORP (SYY): Free Stock Analysis Report

TYSON FOODS A (TSN): Free Stock Analysis Report

HORMEL FOODS CP (HRL): Free Stock Analysis Report

SANDERSON FARMS (SAFM): Free Stock Analysis Report

Original post

Zacks Investment Research

Tyson Foods (TSN) Misses Q4 Earnings, Sales Estimates
 

Related Articles

Tyson Foods (TSN) Misses Q4 Earnings, Sales Estimates

Add a Comment

Comment Guidelines

We encourage you to use comments to engage with other users, share your perspective and ask questions of authors and each other. However, in order to maintain the high level of discourse we’ve all come to value and expect, please keep the following criteria in mind:  

  •            Enrich the conversation, don’t trash it.

  •           Stay focused and on track. Only post material that’s relevant to the topic being discussed. 

  •           Be respectful. Even negative opinions can be framed positively and diplomatically. Avoid profanity, slander or personal attacks directed at an author or another user. Racism, sexism and other forms of discrimination will not be tolerated.

  • Use standard writing style. Include punctuation and upper and lower cases. Comments that are written in all caps and contain excessive use of symbols will be removed.
  • NOTE: Spam and/or promotional messages and comments containing links will be removed. Phone numbers, email addresses, links to personal or business websites, Skype/Telegram/WhatsApp etc. addresses (including links to groups) will also be removed; self-promotional material or business-related solicitations or PR (ie, contact me for signals/advice etc.), and/or any other comment that contains personal contact specifcs or advertising will be removed as well. In addition, any of the above-mentioned violations may result in suspension of your account.
  • Doxxing. We do not allow any sharing of private or personal contact or other information about any individual or organization. This will result in immediate suspension of the commentor and his or her account.
  • Don’t monopolize the conversation. We appreciate passion and conviction, but we also strongly believe in giving everyone a chance to air their point of view. Therefore, in addition to civil interaction, we expect commenters to offer their opinions succinctly and thoughtfully, but not so repeatedly that others are annoyed or offended. If we receive complaints about individuals who take over a thread or forum, we reserve the right to ban them from the site, without recourse.
  • Only English comments will be allowed.
  • Any comment you publish, together with your investing.com profile, will be public on investing.com and may be indexed and available through third party search engines, such as Google.

Perpetrators of spam or abuse will be deleted from the site and prohibited from future registration at Investing.com’s discretion.

Write your thoughts here
 
Are you sure you want to delete this chart?
 
Post
Post also to:
 
Replace the attached chart with a new chart ?
1000
Your ability to comment is currently suspended due to negative user reports. Your status will be reviewed by our moderators.
Please wait a minute before you try to comment again.
Thanks for your comment. Please note that all comments are pending until approved by our moderators. It may therefore take some time before it appears on our website.
 
Are you sure you want to delete this chart?
 
Post
 
Replace the attached chart with a new chart ?
1000
Your ability to comment is currently suspended due to negative user reports. Your status will be reviewed by our moderators.
Please wait a minute before you try to comment again.
Add Chart to Comment
Confirm Block

Are you sure you want to block %USER_NAME%?

By doing so, you and %USER_NAME% will not be able to see any of each other's Investing.com's posts.

%USER_NAME% was successfully added to your Block List

Since you’ve just unblocked this person, you must wait 48 hours before renewing the block.

Report this comment

I feel that this comment is:

Comment flagged

Thank You!

Your report has been sent to our moderators for review
Continue with Apple
Continue with Google
or
Sign up with Email