Who is Kevin Hassett? Wolfe looks at the Trump ally tipped to become Fed Chair.
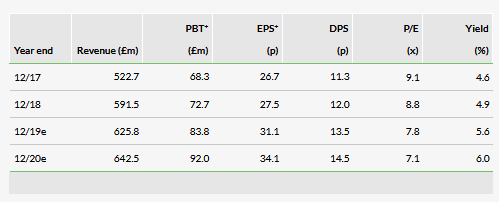
In the first four months of FY19, Tyman Plc (LON:TYMN)’s headline revenue increased by 15% y-o-y and was flat in underlying terms (excluding FX and acquisition effects). While activity levels were slightly lower than management expected, full-year operating profit guidance and our estimates are unchanged. Earnings multiples remain in single digit territory and Tyman now offers a prospective 5.6% dividend yield also.

Flat underlying revenues boosted by acquisitions
We believe that each of Tyman’s three regions raised average pricing by 2-4% at the beginning of the year, suggesting that underlying volumes were down by a similar amount in the first four months of the year. (As noted, however, this is not the busiest sales period.) From management’s comments, the US appears to have been the main area of softness which may have partly been due to service issues in some cases. Elsewhere, ERA and SchlegelGiesse (SG) seem to be performing as expected. No specific reference was made to individual acquisitions; an additional two months or so of Ashland Hardware (USA/AmesburyTruth) at the start of the year will have been the most significant contributor, with lesser benefits in the UK/ERA (Zoo Hardware, Profab, Y-Cam) and RoW/SG (Reguitti) also.
Composition of expected FY19 progress
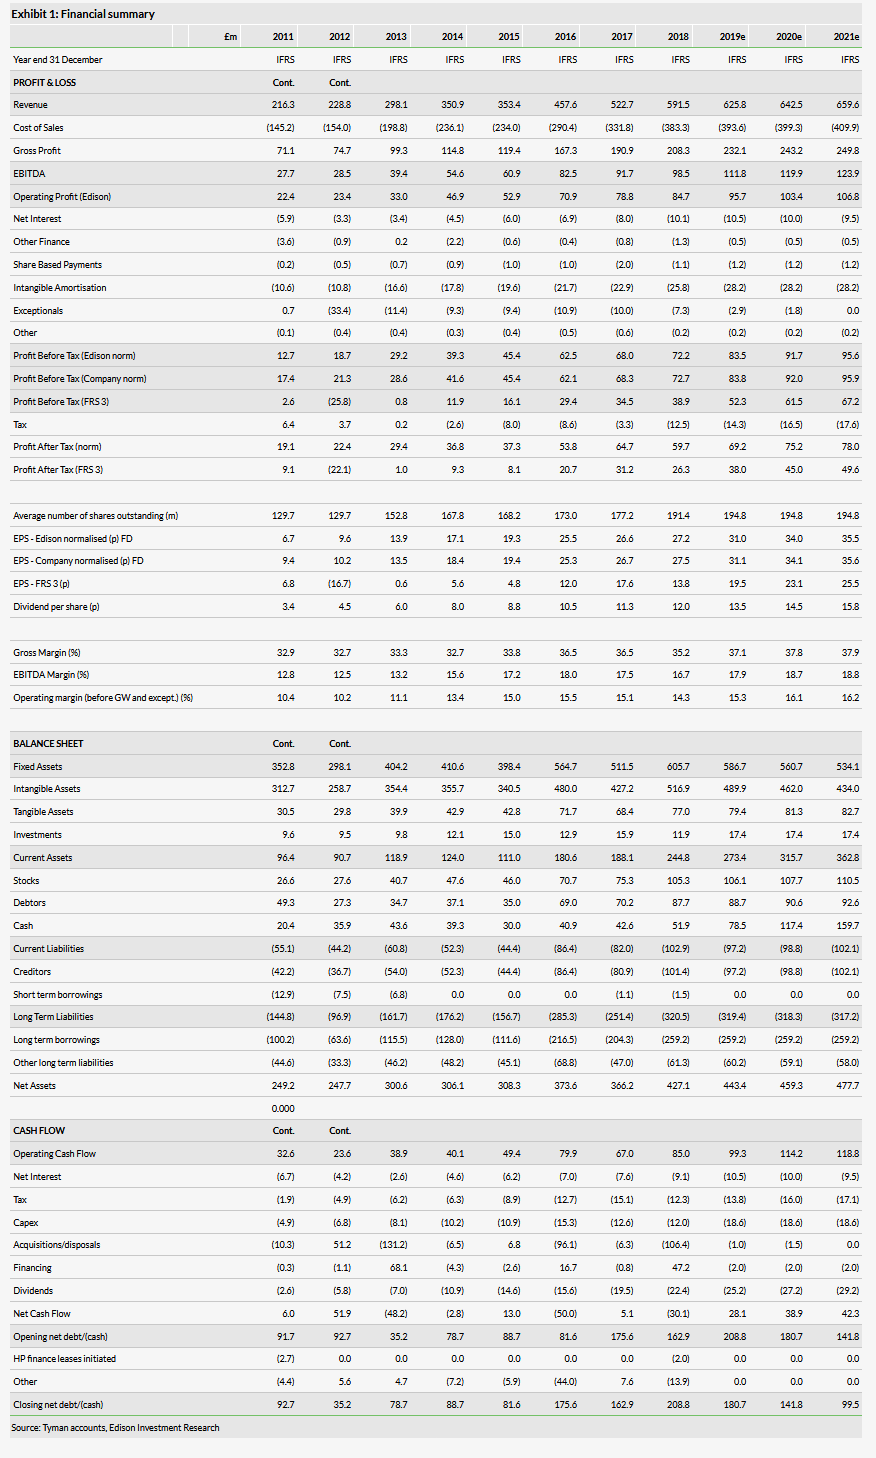
By definition, the y-o-y benefits from acquisitions will moderate as the year progresses. For the record, around three quarters of our expected FY19 c £11m EBIT uplift is derived organically; AmesburyTruth is the largest contributor to this in value terms (boosted by c U$3m incremental footprint programme benefits which are said to be on track). We see SchlegelGiesse generating a better underlying margin improvement, with a smaller gain at ERA also. Potential acquisitions cannot be discounted but it would be reasonable to expect the new executive team (CEO Jo Hallas and CFO Jason Ashton appointed on 1 April and 9 May respectively) to fully familiarise themselves with the business, bringing organic progress more into the spotlight during this period.
Valuation: Single digit P/E multiples
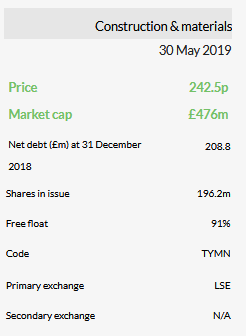
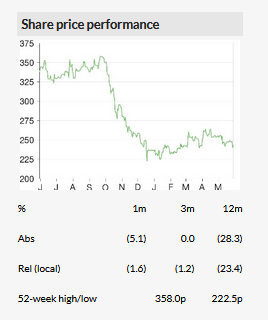
Tyman’s share price has largely been between 230–260p over the last six months. It currently sits towards the middle of this range and is flat overall, broadly matching the FTSE All-Share Index over this time period. Valuation metrics are slightly lower than when we last wrote and a 7.8x P/E and 5.9x EV/EBITDA (adjusted for pensions cash) continue to understate the underlying business quality in our view.


Business description
Tyman’s product portfolio substantially addresses the residential RMI and building markets with increasing commercial sector exposure following acquisitions. It manufactures and sources window and door hardware and seals, reporting in three divisions: AmesburyTruth (North America; 64% of reported FY18 revenue), ERA (UK ;16%) and SchlegelGiesse (RoW; 20%).
