Crude oil has been an important variable in the stock markets of late. Some days I hear that it is correlated with stocks and others it is not. Seems to me like crude’s relationships to stocks might be easy to see over the long term, but day to day, not be so easy to determine. Like Dr. Jekyll and Mr. Hyde.
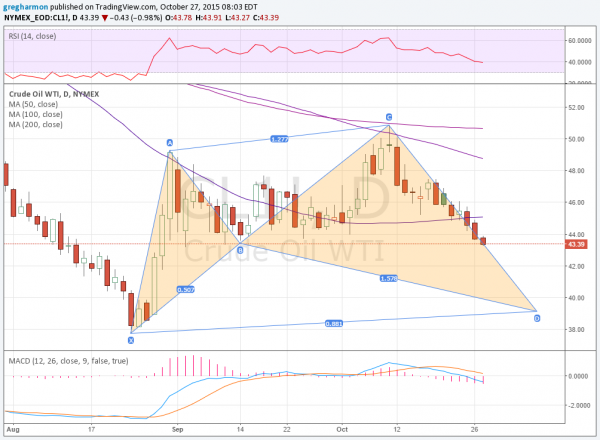
The short term view shows some of that two sided craziness. The chart below shows a lot of it. The price action since August has exhibited a bullish Shark harmonic. Bullish because it looks for a possible reversal, but not until it confirms at point D lower at 39. It also shows how the falling 50, 100 and 200 day SMA’s have acted as resistance. Down and up in the same chart.

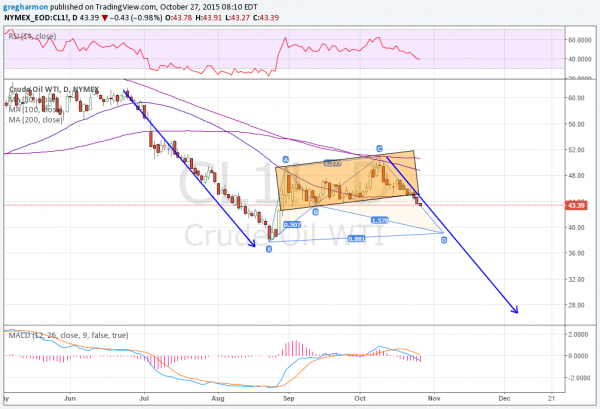
A second view over a slightly longer scale suggests the dive lower could be much deeper. The chart below shows that the consolidation in September and October could be a bear flag. And with a break lower out of the flag, it would suggest a Measured Move lower to 27.

Both of these views are supported by bearish momentum indicators. The RSI failed at 60, and is moving lower in bearish territory, while the MACD is crossed down and falling. Backing out can give some needed perspective, like if Dr. Jekyll stays on his proper meds.
Disclaimer: The information in this blog post represents my own opinions and does not contain a recommendation for any particular security or investment. I or my affiliates may hold positions or other interests in securities mentioned in the Blog. Please see my Disclaimer page for my full disclaimer.
