Is it legal to have two consecutive red days? We have to check the by-laws of NYSE and read the web site of the FED. It might be against the mandate.
But here we are. We had a bit of a squeeze in between. I was expecting a range bound day with slight up close. But it was a range bound day with small loss.Like I said yesterday, earlier, the dip would have been bought and some more. The market does look tired.
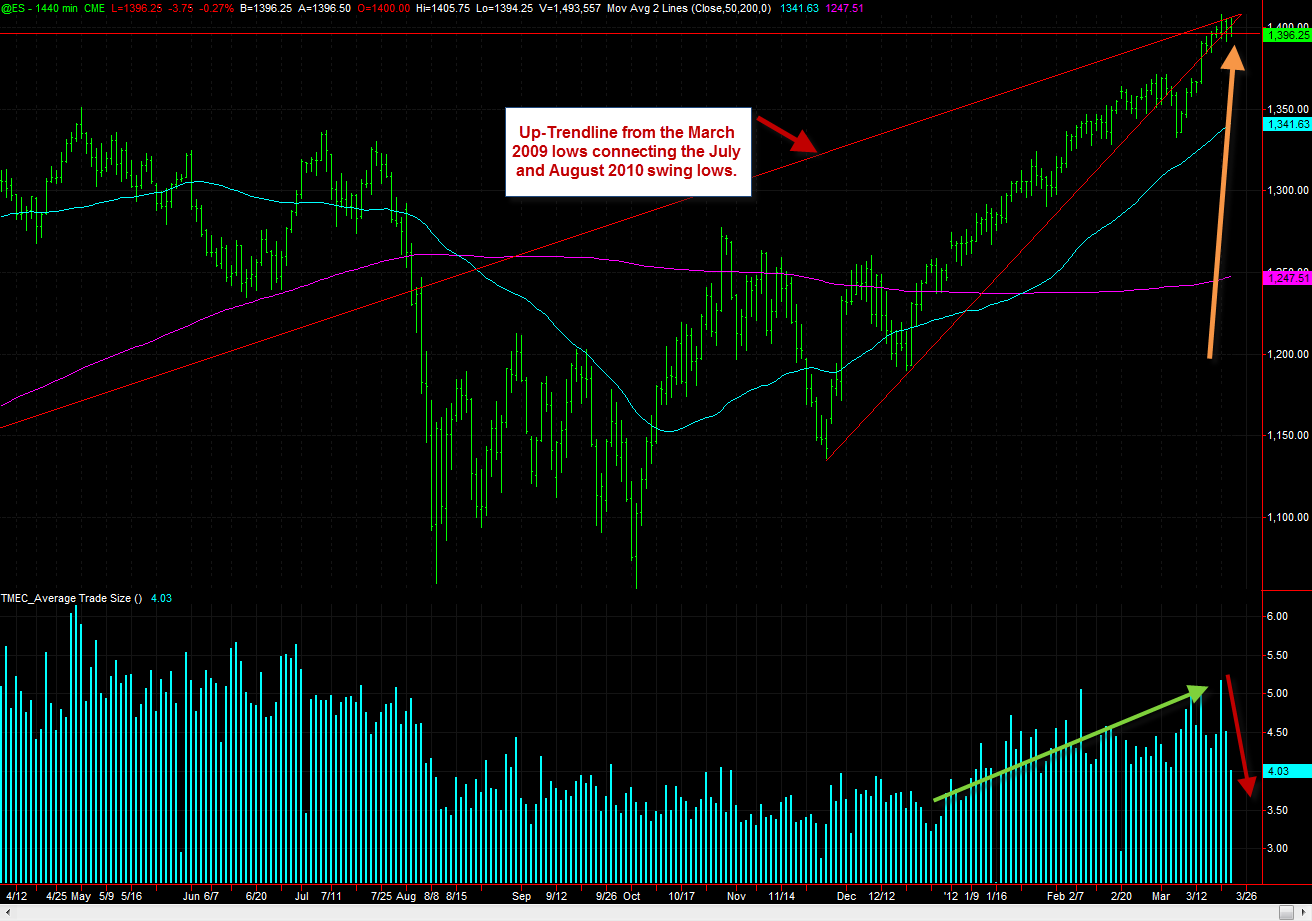
I have borrowed a chart from ZH for whatever it is worth.

While I am sure rather confident that we will reach around 1450 in SPX by mid-April and the above chart is ultimately meaningless, it is relevant at this point of time. Short term cycles are calling for some weakness by the last week of March and that call is consistent with the seasonality factors as well.
I would not be surprised to see a decent sized sell off today although Thursdays have been most bullish days since October 2011. This pull back will be short and possibly not too deep and a buying opportunity for the last pop.
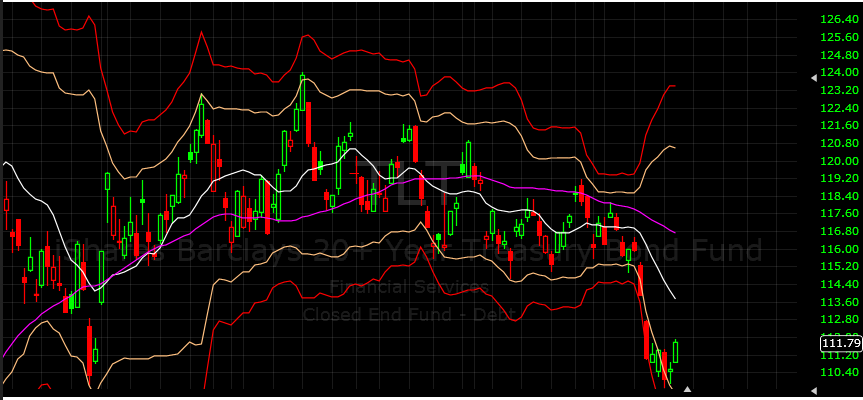
For the 2nd day in a row, bonds were higher.

As you can see it is recovering from deep oversold level and has some good space to run. That again is consistent with the call for correction in equities.
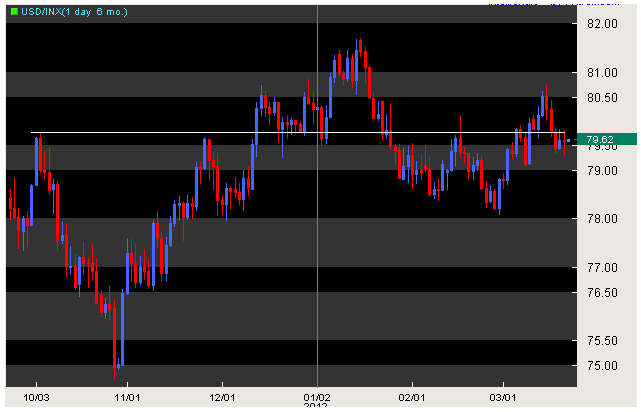
While Euro was unable to break above the H&S level, US $ is making preparation for breaking its H&S range.

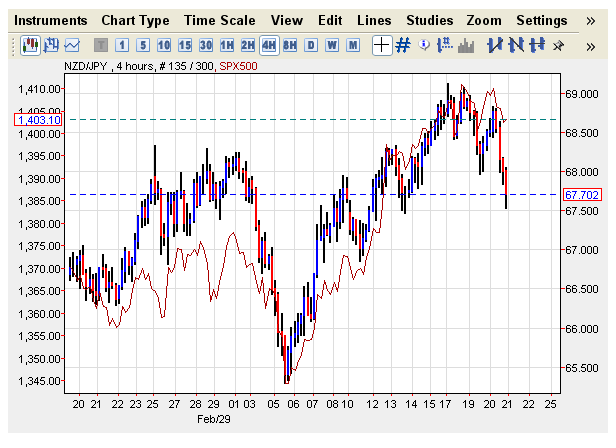
When that happens, it will cause some damage to the risk assets. I expect that to happen soon. On the other hand NZD fell hard after US close as traders were disappointed with NZ growth data. Will the algos follow the NZ $ tomorrow? Both the 2 HR and 4 HR comparison with NZD/JPY and SPX shows that SPX has lots of room to come down.

This is not an exact science and it does not always follow the same path. But seeing that the correlation has worked well in the recent past, we can only expect it to follow suit in future. More so when cycle and seasonality and liquidity in the market seem to agree.
Next few days are going to be important and will define how the market is going to behave in April.
But here we are. We had a bit of a squeeze in between. I was expecting a range bound day with slight up close. But it was a range bound day with small loss.Like I said yesterday, earlier, the dip would have been bought and some more. The market does look tired.
I have borrowed a chart from ZH for whatever it is worth.

While I am sure rather confident that we will reach around 1450 in SPX by mid-April and the above chart is ultimately meaningless, it is relevant at this point of time. Short term cycles are calling for some weakness by the last week of March and that call is consistent with the seasonality factors as well.
I would not be surprised to see a decent sized sell off today although Thursdays have been most bullish days since October 2011. This pull back will be short and possibly not too deep and a buying opportunity for the last pop.
For the 2nd day in a row, bonds were higher.

As you can see it is recovering from deep oversold level and has some good space to run. That again is consistent with the call for correction in equities.
While Euro was unable to break above the H&S level, US $ is making preparation for breaking its H&S range.

When that happens, it will cause some damage to the risk assets. I expect that to happen soon. On the other hand NZD fell hard after US close as traders were disappointed with NZ growth data. Will the algos follow the NZ $ tomorrow? Both the 2 HR and 4 HR comparison with NZD/JPY and SPX shows that SPX has lots of room to come down.

This is not an exact science and it does not always follow the same path. But seeing that the correlation has worked well in the recent past, we can only expect it to follow suit in future. More so when cycle and seasonality and liquidity in the market seem to agree.
Next few days are going to be important and will define how the market is going to behave in April.
