I rarely discuss currencies on the blog, but the setup taking place in the Japanese yen is one that is hard to ignore. Let me explain…
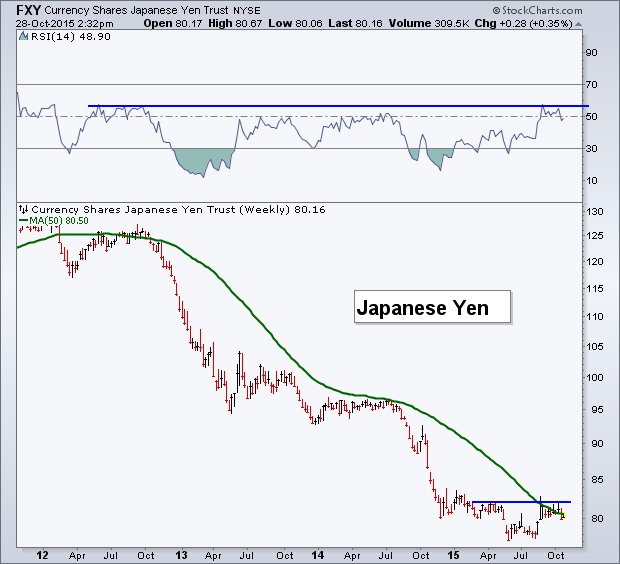
I’m going to dive into two charts for the yen. The first is below and is a weekly chart of the Currency Shares Japanese Yen ETF (N:FXY) going back to 2012. You can see the clear down trend that’s taken place in the yen. That trend has been helped to be defined by the 50-week Moving Average, which is very close to the 251-day Moving Average. I like to watch the 251-day MA because that’s the number of trading days (on average) in a calendar year. We can see this long-term Moving Average was tested during the short bounce in 2012 and again in 2014. Also, while looking at price action, FXY has been struggling to get above the prior 2015 high at $82. Both of these levels of resistance are likely to make it tough for buyers to push the yen higher.
Next, we have momentum – specifically the Relative Strength Index (RSI) indicator. This momentum tool has recently tested the peak level in momentum back in 2012 and marks the top of the bearish range that momentum is currently oscillating in. With price sitting under two established levels of resistance, it's hard to see momentum getting enough juice to breakout of this range.

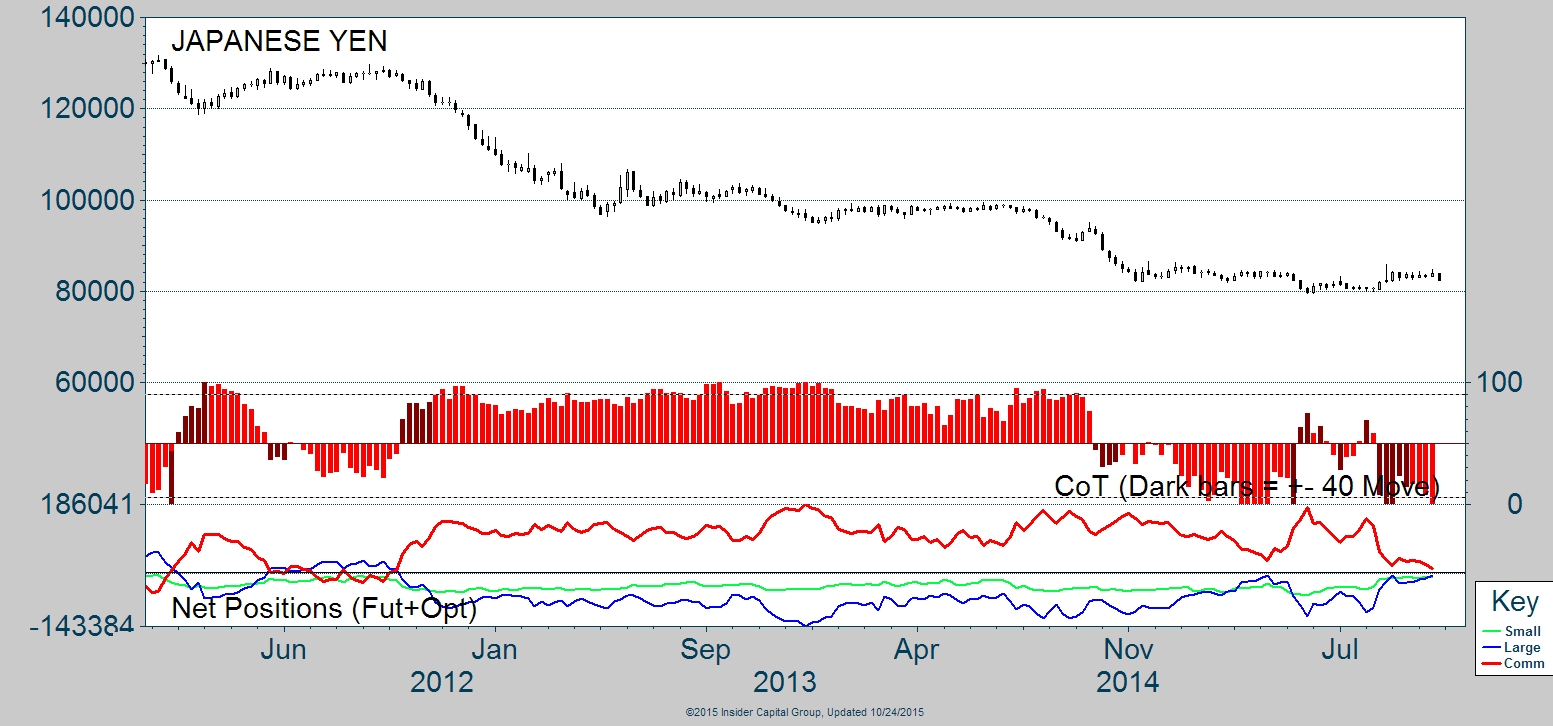
So we know what price action and momentum are doing, the next chart I want to show depicts the actions traders are taking in the yen market, based on COT data.
Commercial traders have been net-long the yen for a couple of years. This positioning comes after spending a few months net-short back in 2012 right before the yen began to fall at the same levels mentioned above when FXY hit its 50-week Moving Average. Once again, we are seeing Commercial Traders getting close to moving net-short as they turn increasingly bearish on the Japanese currency. Will the move, if it happens, to becoming net-short by this classification of traders mark a repeat of 2012 and send the yen lower? We’ll see.
It’s often said that the Commercial Traders are the ‘smart money’ within a market, but I think it’s painting with quite a big brush to call the whole group ‘smart money.’ However, what they are is big money, and when those with deep pockets shift their bias like what’s happening in the yen, it makes it extremely difficult for those on the other side of the trade. I’ll be watching over the coming weeks how the Commercial Traders get positioned, and if they do indeed become net-sellers of the Japanese currency.

Disclaimer: Do not construe anything written in this post or this blog in its entirety as a recommendation, research, or an offer to buy or sell any securities. Everything in this post is meant for educational and entertainment purposes only. I or my affiliates may hold positions in securities mentioned in the blog. Please see my Disclosure page for full disclaimer.
