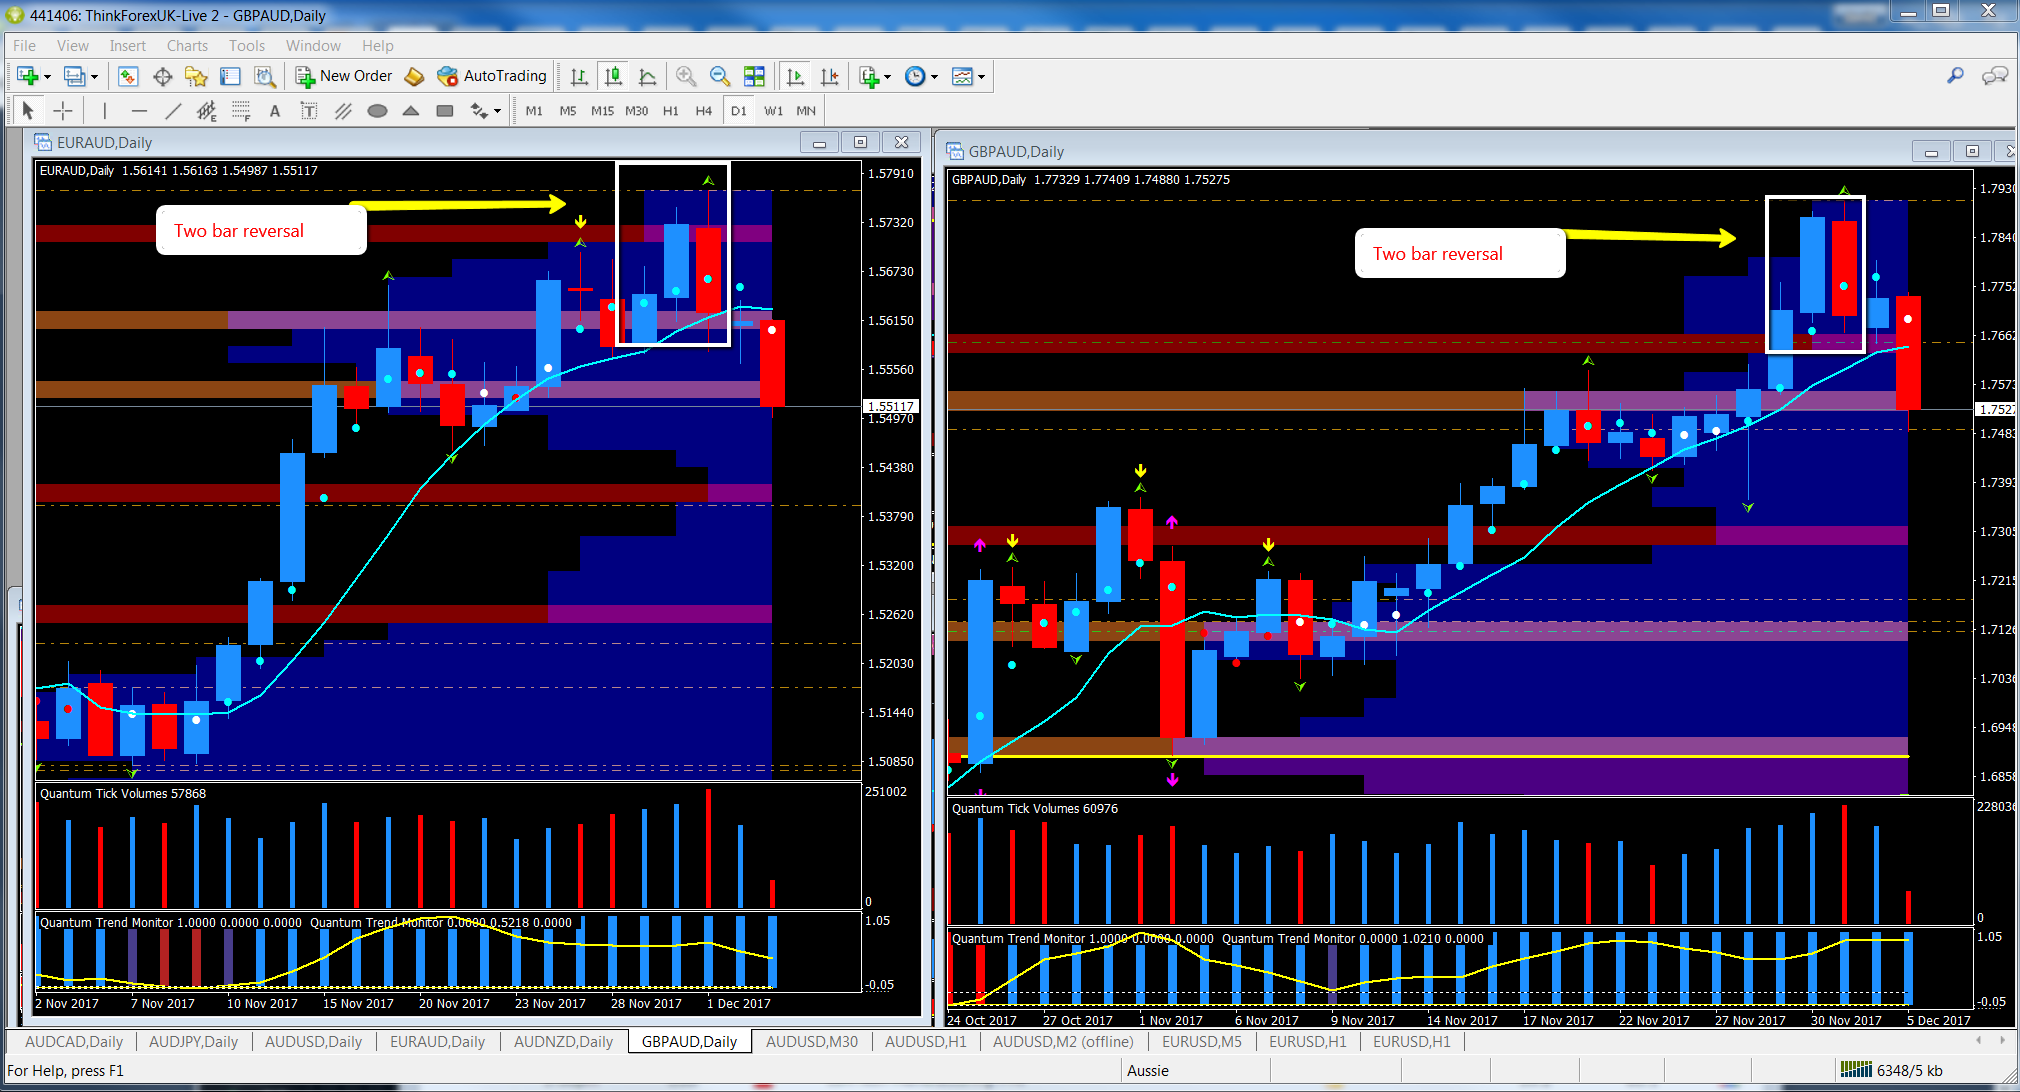
One of my favourite candle patterns when trading forex is a pattern that occurs and recurs on all time frames, and it is the two bar reversal, which when complete can deliver a correction of the trend, herald the start of a breakaway from congestion, and even a full blown reversal. This pattern can also be given added impetus if it appears ahead of a significant item of fundamental news, particularly if the release reinforces the pattern’s technical set up on the chart.
Put simply, a two bar reversal occurs when we have two similar size candles, one up and one down (or vice versa), and when overlaid create either a classic shooting star or hammer candle.
And we have had two great examples on the EUR/AUD and GBP/AUD following the RBA statement, the Retail Sales number, and Current Account data.
As we can see both charts are structurally very similar, with the two bar reversal pattern clearly in evidence at the end of last week’s trading session, and note the increase in volume under the down candle on both, followed by the weak attempt to rally, particularly on the GBP/AUD.
Following the failure of yesterday’s rally today’s sharp move lower has taken these pairs to test minor support, which if breached will open the way to a deeper move lower for both.
For EUR/AUD a failure to hold the 1.55 price point would take the pair quickly through a low volume node and down to more significant support at 1.5458. For GBP/AUD the key level is in the 1.7490 region, which marks the volume point of control on the 4 hour chart, and gives the pair some respite from the current bearish momentum.
