If you’re like most income investors, you stop in your tracks when you spot a massive payout—like 16% or more. A yield like that means you’re doubling the market’s historical annual return in dividends alone.
What’s not to like?
Too bad dividends that big are almost always warning signs. That’s the case with the two stocks we’re going to dive into today. You’ll want to avoid their “siren song” 16%+ payouts now—or sell if they’re taking up space in your portfolio.
When the Market and Reality Part Ways
This story actually starts more than a decade ago—in the middle of the collapse of 2008.
If you were investing back then, you likely remember the phrase “mortgage-backed security”—MBS for short. This is a kind of derivative that was supposed to make mortgage markets safer, but actually made them explode.
Here’s how an MBS works: imagine you have a collection of, say, 100 mortgages and you bundle those mortgages together and say that all of those mortgages make up a company. The company’s assets are those mortgages, and its operating income is the interest payments borrowers pay on their homes.
You can now sell bonds based on the company’s creditworthiness (which will be a reflection of the mortgage borrowers’ combined creditworthiness). Or you could sell stocks in the company, whose value would rise and fall based on whether those mortgages are paid off early, whether they default, if they’re refinanced and so on.
The bonds and stocks in these types of “companies” were the mortgage-backed securities that wrecked the global economy. It’s easy to see why: that company is an abstraction of a bunch of debts, and the bonds and stocks in those debts are an abstraction of an abstraction.
In short, the market got too far removed from reality, and the house of cards broke down.
This is why banks are more careful with mortgage-backed securities today, and many avoid them altogether. But a worrying trend has emerged: a re-emergence of the MBS in the form of the collateralized loan obligation, or CLO.
CLOs: 2008 All Over Again?
CLOs work just like mortgage-backed securities: same structure, same level of abstraction, same amount of speculation. The difference is that, instead of mortgages being bundled together, it’s business loans.
Like mortgage-backed securities, these are fine investments—until they aren’t. If businesses are doing well and have enough cash flow to pay their debts, CLOs work. That’s why two publicly traded CLO-investment specialists, Oxford Lane Capital (OXLC) and Eagle Point Credit Company (ECC), looked great for a while:
CLO Darlings Doing Great … for Now
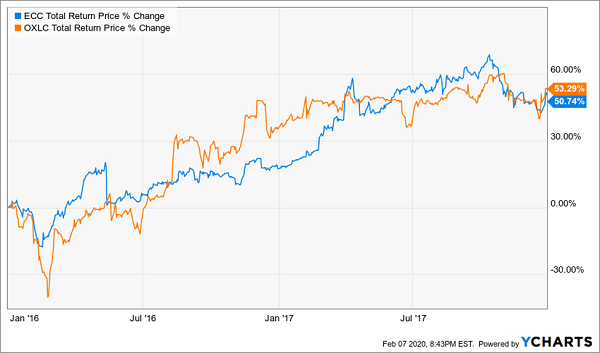
In just two years, from early 2016 to early 2018, these companies delivered 50%+ total returns. And investors were happy with the massive dividends, which were in the high teens at the time. Even now, ECC yields 16% and OXLC yields 17%.
Then this happened:
ECC’s Returns Go Cold
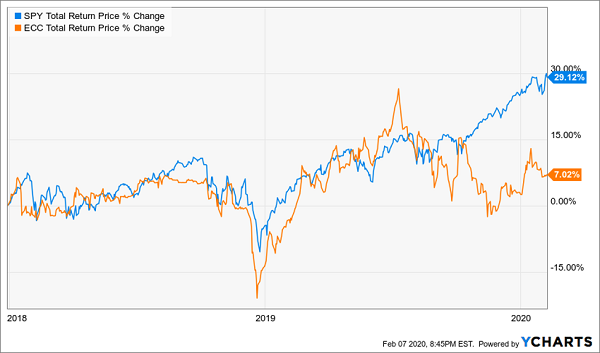
ECC flatlined, underperforming the less risky S&P 500 SPDR ETF (SPY (NYSE:SPY)) from early 2018 to early 2020, and things don’t look like they’ll get much better today. In part, this is due to management’s high fees, which are almost 10% of the company’s total assets.
But that’s not the only reason. Since 2017, worries that the business loans in CLOs may earn less interest in the future have driven down these derivatives’ market value, which means the value of ECC’s investments has been falling for years, starting even when ECC’s stock price was soaring.
Worries Mount Over CLOs
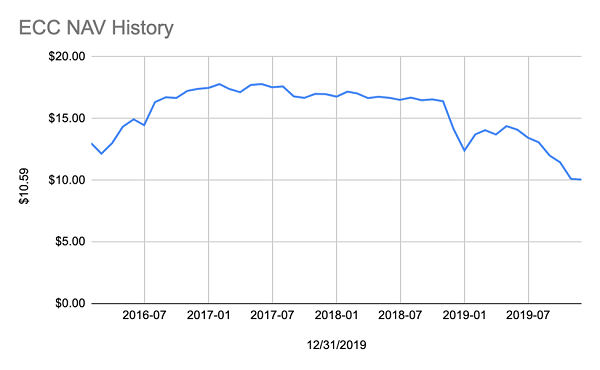
Source: Eagle Point Credit Company, CEF Insider
OXLC has done much better, at least on a stock-price basis. But as this chart shows, there’s reason to worry:
A Huge Dip in Late 2019
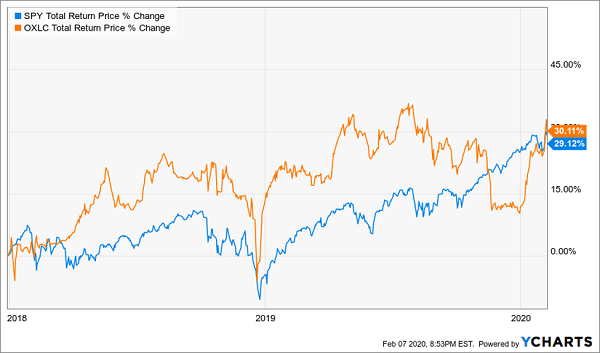
While OXLC was crushing the stock market for years, it took a big dive in late 2019 because its net asset value fell 17.4%. When the company reiterated that it would keep paying its current dividend, investors bought back in, and a 2.6% gain in its NAV in early February has helped attract more investor attention.
There’s just one problem: its NAV, at $6.81 per share, is still down from the $8.01 it was less than six months ago, so at current prices you’re paying more for assets that, even if they’ve stabilized, haven’t fully recovered. Worse, at OXLC’s current price, you’re paying a 35%+ premium to NAV.
Yield hunters may wave this away as a non-issue; as long as they’re getting their dividends, they’re happy. But this NAV decline puts their dividends at risk.
At current levels, OXLC needs to earn a 23.8% annualized return just to maintain its payouts without digging into its portfolio to pay shareholders. Since that’s more than double the company’s annualized return since it started operating in 2011, a dividend cut is likely. When that comes, many of OXLC’s yield-thirsty investors will sell—and fast.
How to Get a Massive Payout the Safe and Sure Way
Don’t risk your retirement with yield traps like these. Instead, look to the four solid closed-end funds (CEFs) I’ve got for you right here. These four funds yield 8.4% now and position you for dividend growth, too.
And you’ll collect these dividends without lying awake at night worrying about CLOs, mortgage-backed securities or other complex investments that even top advisors have trouble explaining!
Instead, you can rest easy with 4 of my best picks for your retirement portfolio now. Pick No. 4, for example, is the poster child for my approach to high-yield investing.
This fund boasts something most people will tell you can’t exist: a double-digit dividend that’s grown at a triple-digit rate! But that’s exactly what you get with this CEF: it yields a mammoth 10.3%, and its payout has exploded 113% in the last decade.
The Double-Digit Dividend That Soared
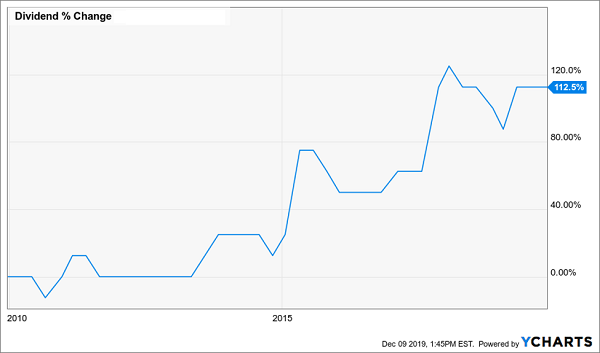
Not only that, but this fund’s total return has outrun that of the market, too, with most of its return in cash, thanks to its massive—and growing—payout:
Beating Regular Stocks, With a Big Dividend, to Boot
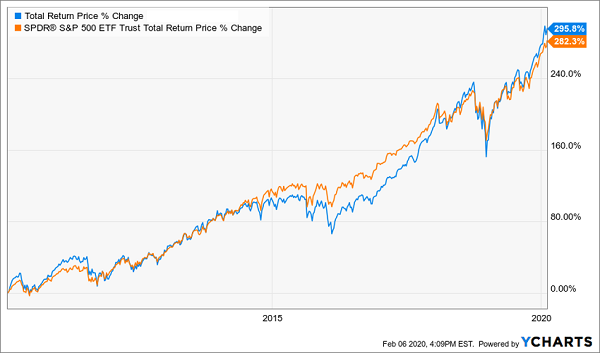
And yes, I’m expecting even more upside from this fund and the three others in the four-fund “mini-portfolio” I want to show you now, thanks to their totally undeserved discounts to NAV.
Disclosure: Brett Owens and Michael Foster are contrarian income investors who look for undervalued stocks/funds across the U.S. markets. Click here to learn how to profit from their strategies in the latest report, "7 Great Dividend Growth Stocks for a Secure Retirement."
