Investing.com’s stocks of the week
Twitter Inc (NYSE:TWTR) is scheduled to report third-quarter earnings before the market opens tomorrow, Oct. 25. TWTR stock has been relatively quiet on the charts over the last two months, per the stock's 60-day historical volatility of 40.9%, which registers in the 6th annual percentile. However, the options market is pricing in a bigger-than-usual post-earnings move for tomorrow's trading.
At last check, Trade-Alert placed the implied daily earnings move for TWTR at 20.6% -- nearly double the 11.1% next-day move the stock has averaged over the last two years. It's been an even split between positive and negative earnings reactions over the past eight quarters, though the two most recent were to the downside. And just one of these post-earnings performances -- a 20.5% plunge this past July -- was large enough to meet or exceed the percentage move the options market is expecting this time around.
Looking at recent options activity, it seems speculative players are positioning for another swing lower. At the International Securities Exchange (ISE), Chicago Board Options Exchange (CBOE), and NASDAQ OMX PHLX (PHLX), TWTR's 10-day put/call volume ratio of 0.58 ranks in the 94th annual percentile. While the ratio shows that more calls than puts have been bought to open over the last two weeks, the percentile ranking indicates the rate of put buying relative to call buying has been quicker than usual.
At the moment, TWTR's 30-day at-the-money implied volatility (IV) of 84.1% ranks in the 100th annual percentile, indicating short-term options are pricing in higher-than-usual volatility expectations -- not unusual ahead of a scheduled event, like earnings. Meanwhile, the stock's 30-day IV skew of 7.5% registers in the 95th percentile of its 12-month range, meaning near-term puts have rarely been more expensive than calls, from a volatility perspective.
Outside of the options pits, short sellers have reduced their exposure to Twitter. Short interest on the social media stock plunged 19.1% in the two most recent reporting periods to 44.51 million shares -- the fewest since early June. However, these bearish bets still account for a healthy 6.5% of TWTR's float, or about two times its average daily pace of trading.
Analysts, meanwhile, are mostly skeptical of Twitter stock, with 21 of 28 maintaining a "hold" or worse recommendation. Meanwhile, the average 12-month price target of $33.09 is a 13% premium to the equity's current perch.
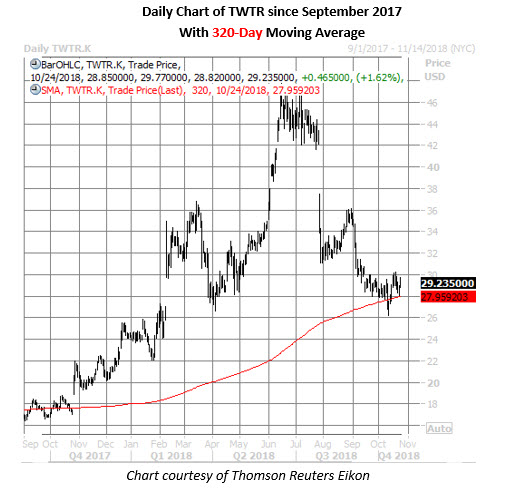
On the charts, TWTR stock topped out at a three-year high of $47.79 back on June 15, but has since shed 39%. More recently, the selling has stalled out near the equity's 320-day moving average, which served as a magnet for the shares in late 2017. Today, Twitter shares are trading up 1.6% at $29.24, bringing their year-to-date gain to nearly 22%.

