Investing.com’s stocks of the week
Summary
- The credit markets are showing modest signs of stress.
- The yield curve continues to narrow.
- The second GDP report had a strong headline number, but several key one-off events were responsible for the strong report.
The purpose of the Turning Points Newsletter is to look at the long-leading, leading, and coincidental indicators to determine if the economic trajectory has changed from expansion to contraction - to see if the economy has reached a "turning point."
As regular readers know, I upped my recession probabilities to about 30% over the last few months, based on declining building permits, heightened corporate paper spreads, a tightening Fed, a flattening yield curve, and a declining equity market.
While the Fed is probably a bit more dovish now, deteriorating conditions in several credit market sectors keep my recession percentage at 30%
Leading Indicators
While the Fed is perhaps in less of a tightening mood, the credit markets are showing new signs of stress.
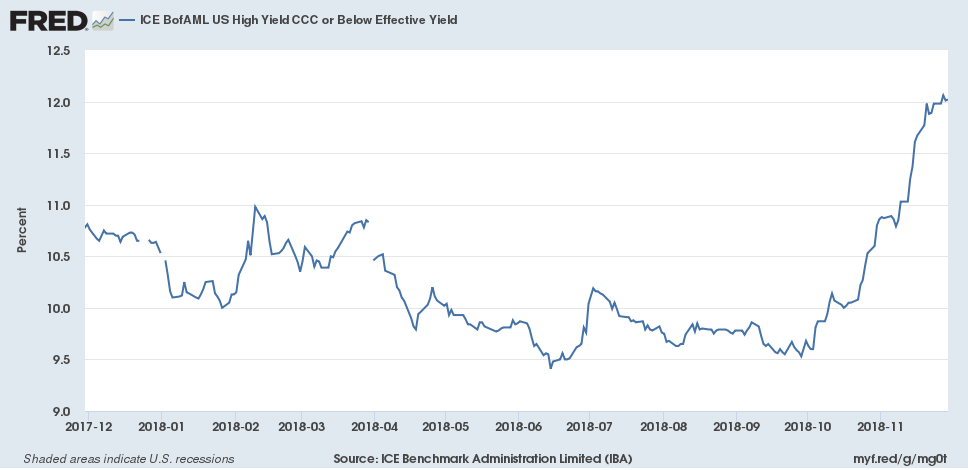
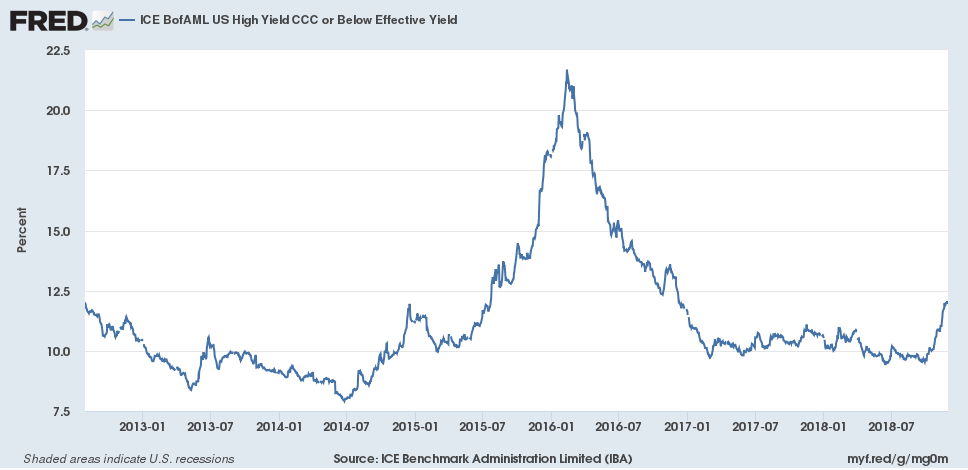
Oil's price drop has caused stress in the energy sector, spiking junk bond yields 300 basis points. That's a very big move, especially in the fixed-income market. However, it's not unprecedented:
CCC yields increased to over 20% during the last oil market sell-off.
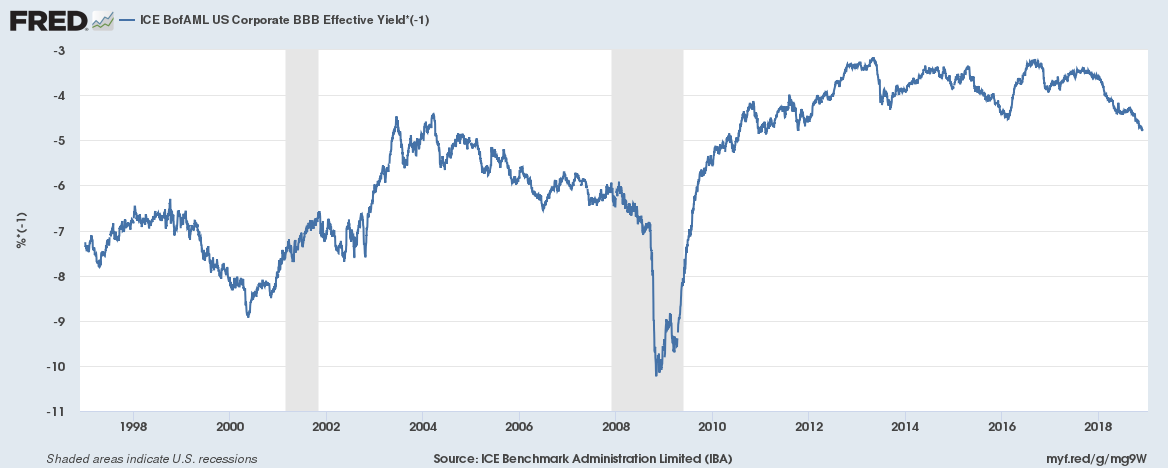
The contamination is spreading a bit:
The BBB is now at its worst level of the expansion (I've inverted the chart, so that down is perceived as negative). In 2016, yields peaked at -4.4%; now they're -4.6%+.
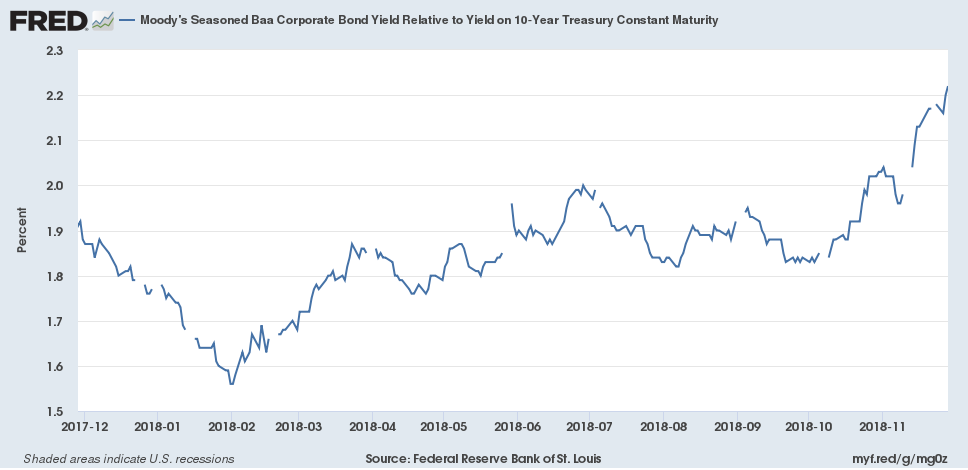
The spread of the Baa to its corresponding Treasury has widened about 30 basis points over the last month.
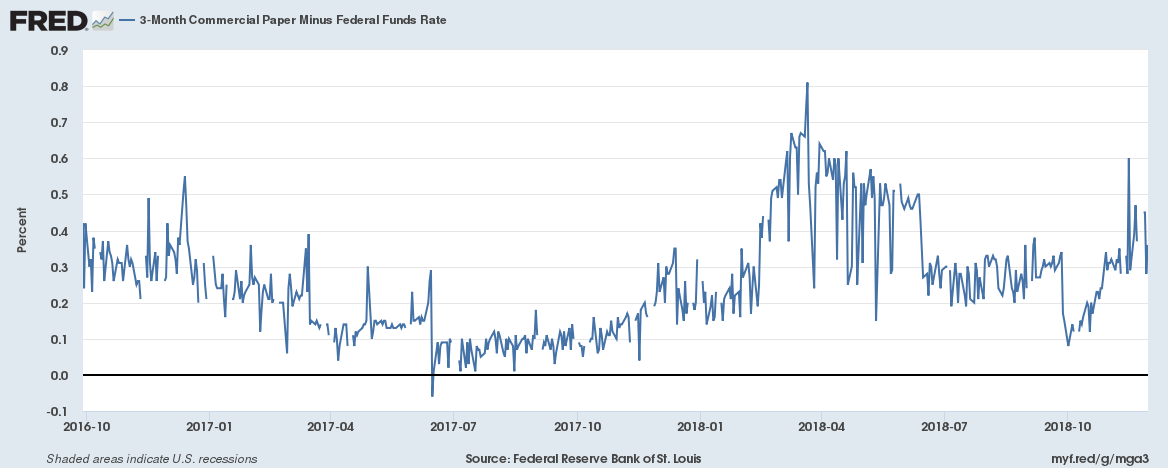
And the commercial paper market remains elevated.
The credit markets are more sensitive to potential financial shocks than other areas of the economy. We expect them to widen 12-24 months before a recession.
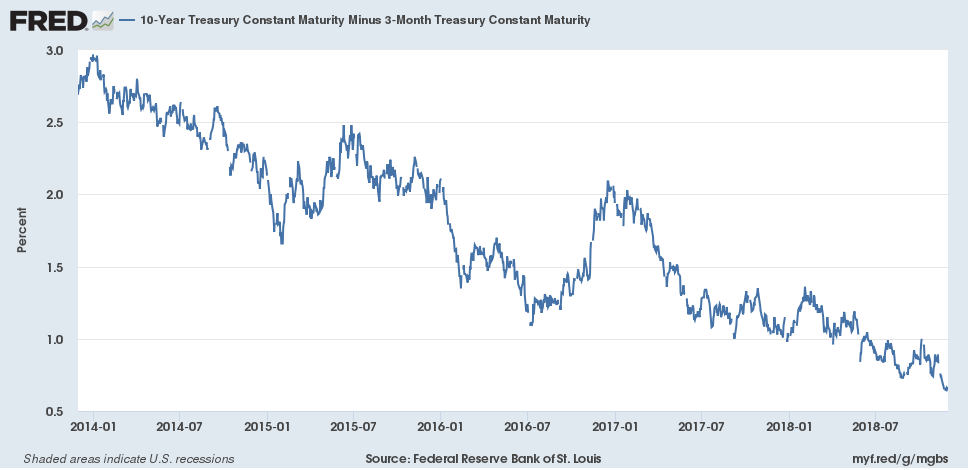
Finally, the yield curve continues to flatten:
The 10-year-three-month spread continues to narrow.
Coincidental Indicators
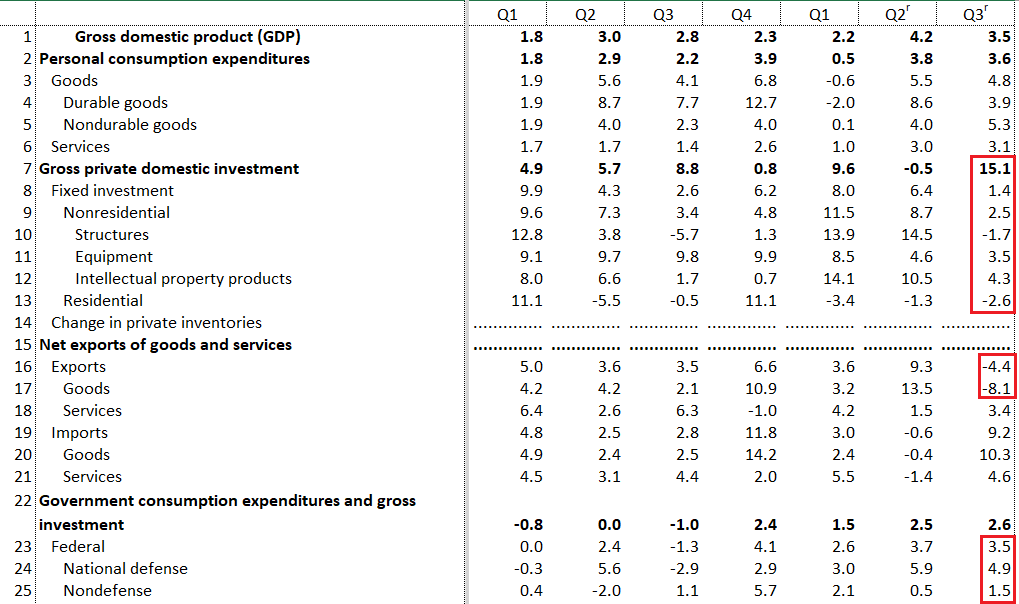
This week, the BEA released the second estimate of the 3Q GDP, which had a 3.5% Q/Q growth rate. Let's look at a few key details:
The above table is from the supplementary report (page 6 of 19) and shows the contribution of the change in private inventories to the 3.5% Q/Q growth rate. The change in nonfarm inventories accounted for 2.29% of the 3.5% growth rate - a whopping 65% of all growth. Firms were stocking up on goods before tariffs went into effect - activity that won't be part of the 4Q numbers.
While investment was strong - it increased 15.1% - the inventory numbers greatly skewed the result. Without that contribution, business spending was weak. Nonresidential investment rose 2.5% - the weakest pace in the last seven quarters. Structural investment decreased 1.7%, and spending on equipment grew 3.5% - also a "weakest in seven quarters" number. Residential investment contracted for a second quarter. Both exports and imports declined as well. Federal spending, however, was up at its second highest rate since 2Q16.
Finally, let's turn to the PCE data, released on Thursday:
PCEs increased at their second strongest pace since March, rising .4% Q/Q. Spending on durable and non-durable goods was slightly weaker than their respective eight-month averages; spending on services was modestly stronger than its 8-month mean.
Some time ago, a commenter described these events as "cracks emerging on a windshield," which I think is an apt description. There are signs of weakness that are spreading. The real issue going forward is does the spread continue or will this trend reverse?
Disclosure:I/we have no positions in any stocks mentioned, and no plans to initiate any positions within the next 72 hours.
I wrote this article myself, and it expresses my own opinions. I am not receiving compensation for it (other than from Seeking Alpha). I have no business relationship with any company whose stock is mentioned in this article.

