
Turning Points For The Week Of March 25-29
The purpose of the Turning Points Newsletter is to look at the long-leading, leading, and coincidental indicators to determine if the economic trajectory has changed from expansion to contraction - to see if we've reached an economic "Turning Point."
Conclusion: My recession probability in the next 6-12 months is still at 30%. While the four-week moving average of initial unemployment claims has improved somewhat, hours worked (still high) have decreased modestly, one-unit building permits are still weaker, and the Treasury market continues to progress in an end-of-cycle manner.
Leading Indicators
Over the last few months, I've highlighted that the four-week moving average of initial unemployment claims appears to have bottomed on September 22, 2018. Claims have risen modestly since:
This data has decreased modestly over the last few weeks. In the latest report, the average was 217,250, 2,500 below the recent low of 200,000, which occurred on January 19. This is obviously good news but is tempered by the decline in average hours worked...
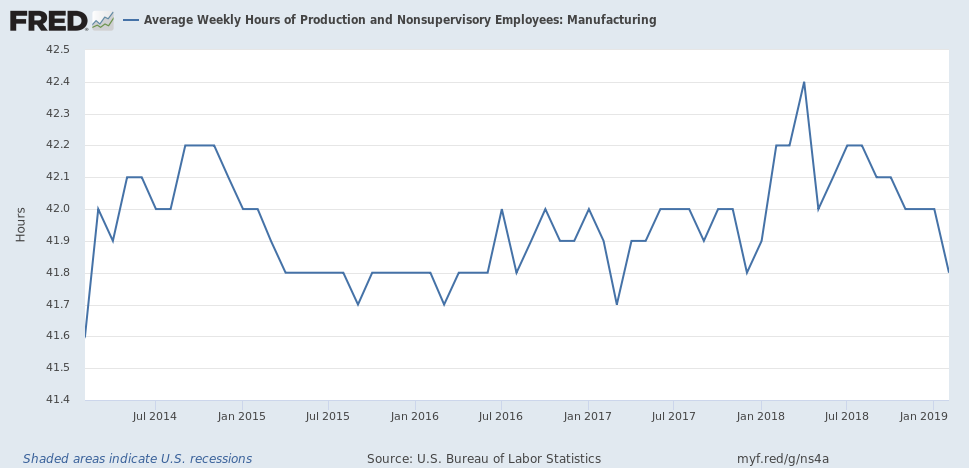
...which have declined on a fairly consistent basis since February 2018. Hours worked are the first labor metric employers will cut as it allows them to maintain their current labor force (remember that over the last year or so, we've consistently heard that companies are having a difficult time finding workers) while still lowering costs. Furthermore, this number is still at high levels relatively speaking:
In addition, the number of people who are still unemployed while still receiving benefits continues to creep higher:
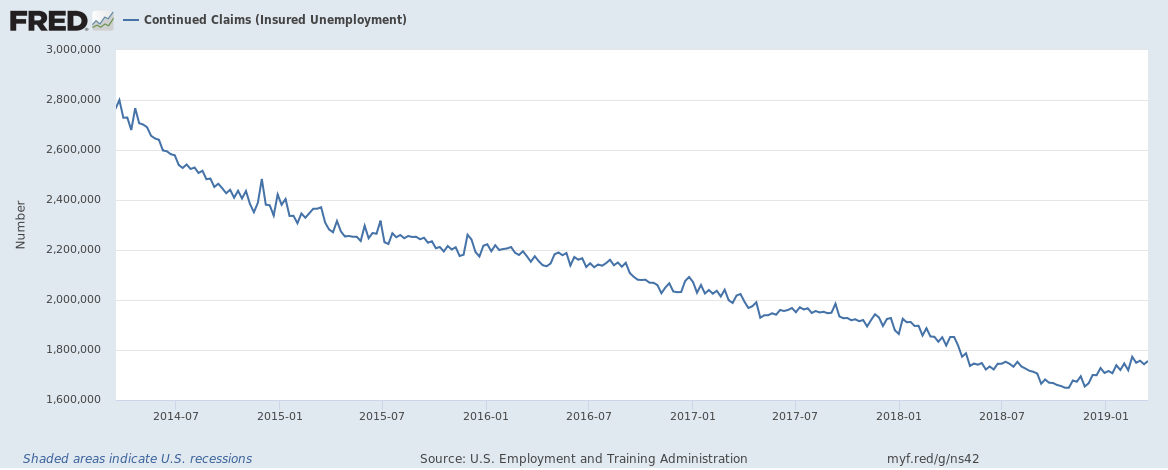
So, the leading employment numbers are still in good shape. We do, however, need to acknowledge a modest deterioration.
This week the Census released the latest building permits data, which was unchanged from the previous month. This leading indicator is still modestly weaker: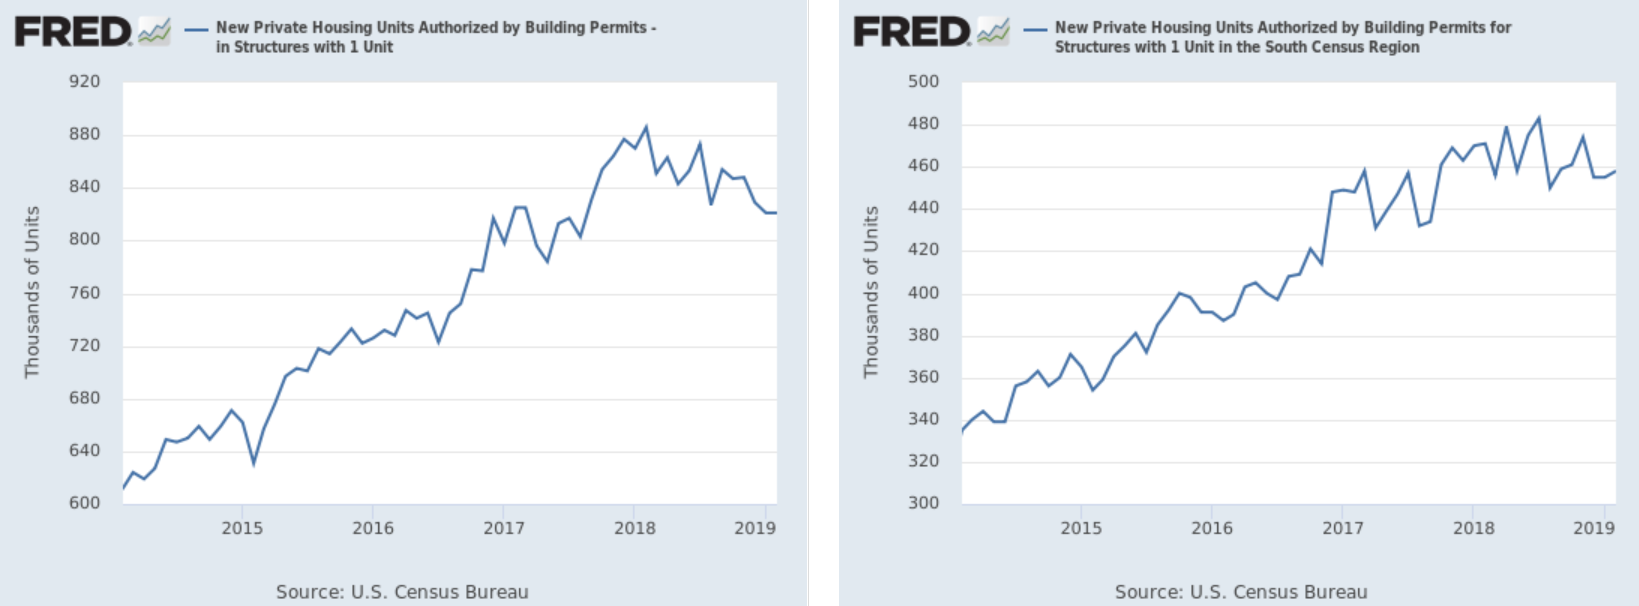
The left chart shows total 1-unit starts which have moved modestly lower over the last year. The right chart shows total starts for the South Census region, which comprises 56% of the total national number. This region's growth is still strong but has moved sideways for the last year.
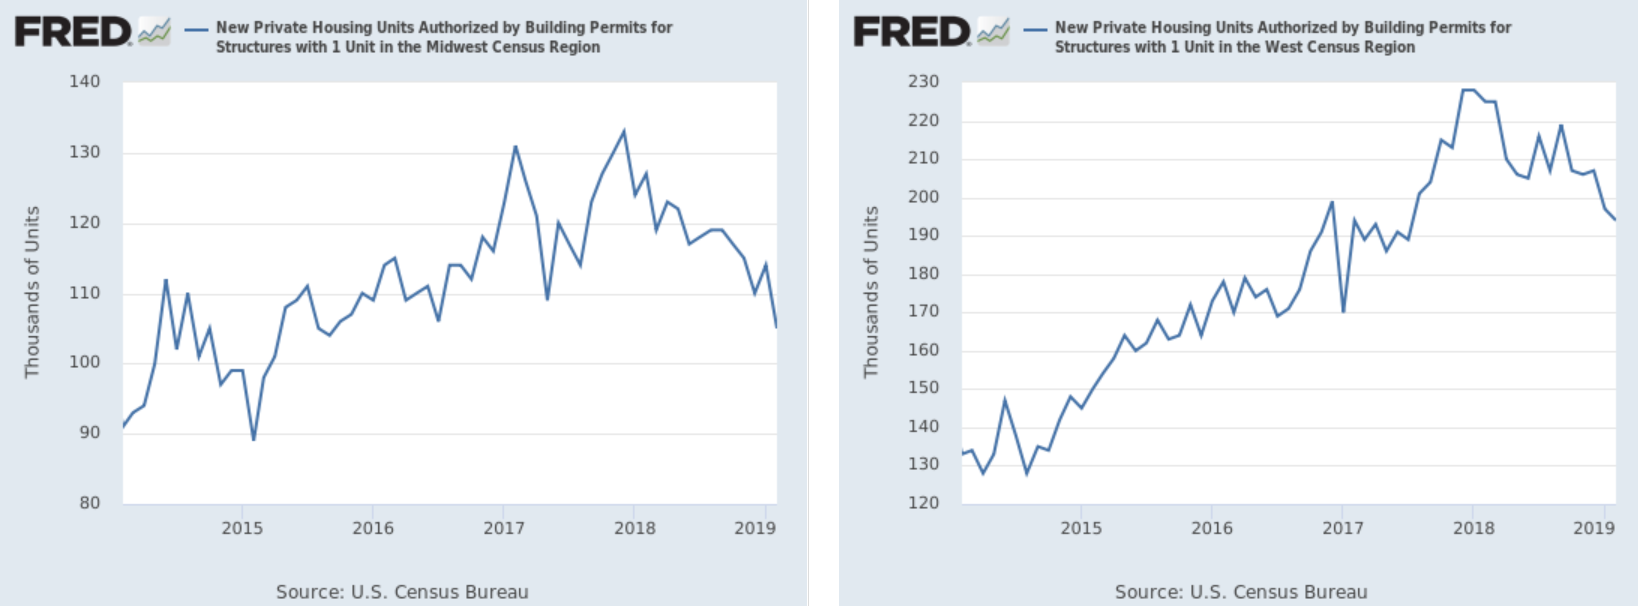
Permits in the Mid-West (left chart; 24% of total permits) and West (right chart; 24% of total permits) have both declined modestly over the last year, which permits in the NE... 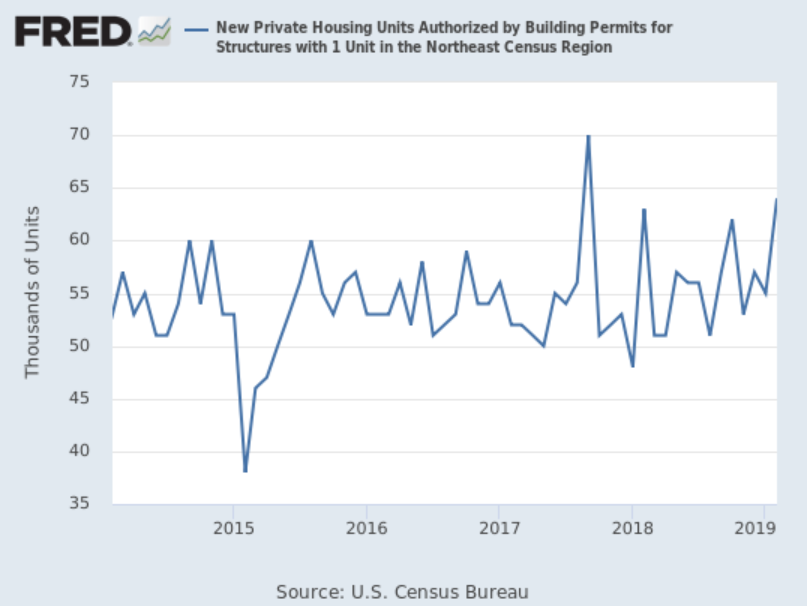
...are modestly higher.
The housing market is marginally weaker due to rising interest rates and affordability issues. However, with interest rates declining, it's possible the deterioration will slow over the coming months.
Finally, we have the yield curve, which continues to behave in a standard, end-of-the-economic-cycle manner.
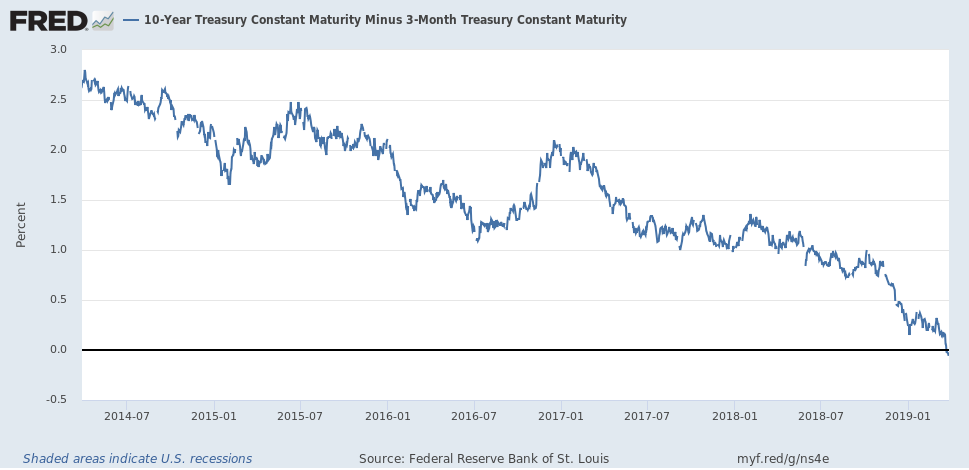
This week, the financial press reported the yield curve's contraction, which has a strong track record of presaging a recession. But the yield curve's internals has been deteriorating since the first of the year.

The 5-1 (in red) and 3-1 (in green) spreads have been inverted since right around the first of the year. The 7-1 spread (in blue) flirted with inversion since the first and formally inverted over the last few weeks.

The 7-year/3-month (in red) and 5-year/3-month (in green) recently inverted while the 10-year/3-month (in blue) is on the verge of doing so.
Finally, notice the sharp drop in the long-end of the curve:
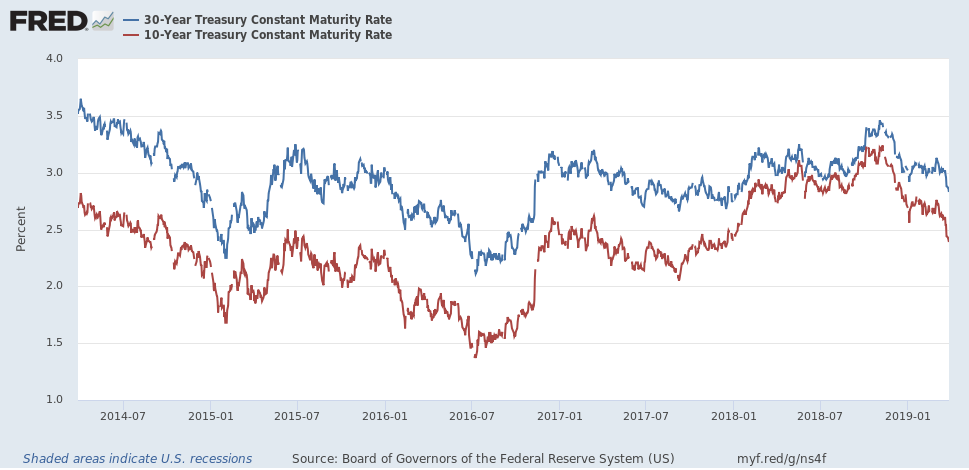
The 30-year Treasury (in blue) has declined from 3.43 to 3.87, while the 10-year Treasury (in red) has dropped from 3.22% to 2.43% since 4Q18. This indicates that the long-end of the Treasury market sees slower growth, which translates into weaker inflation, which makes bonds more attractive.
This week, there were no releases of coincidental economic data.
To conclude, there's a modest weakness in the labor market and housing market indicators. However, it's really the yield curve's behavior that's the lynchpin of my 30% recession probability. Remember there are important behavioral reasons that explain why the yield curve is acting in this manner. And it's these reasons that add up to an increased recession probability.
Disclosure: I/we have no positions in any stocks mentioned, and no plans to initiate any positions within the next 72 hours. I wrote this article myself, and it expresses my own opinions. I am not receiving compensation for it (other than from Seeking Alpha). I have no business relationship with any company whose stock is mentioned in this article.