Turning Points For The Week Of March 11-15Summary
- Leading economic indicators continue to flash yellow.
- The three- and six-month moving averages for new orders of non-defense capital goods are negative.
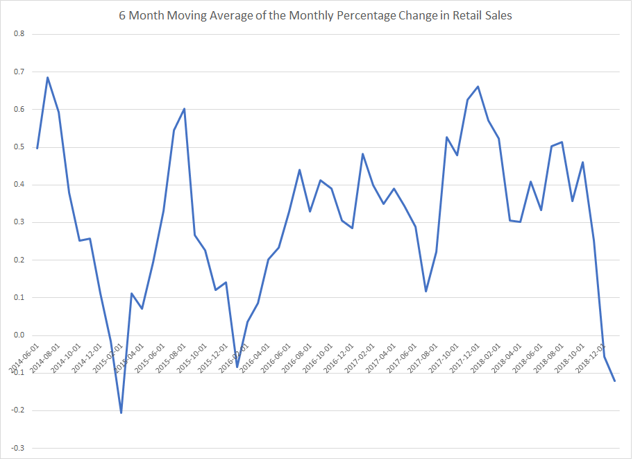
- The three- and six-month moving averages for retail sales are negative.
The purpose of the Turning Points Newsletter is to look at the long-leading, leading, and coincidental economic indicators to determine if the economic trajectory has shifted from expansion to contraction - to see if the economy has reached a "turning point."
My recession probability for the next 6-12 months remains at 30%. The leading labor market indicators continue to flash yellow, the yield curve is still acting in an end-of-the-cycle manner, and the three- and six-month moving averages for new orders of non-defense capital goods are negative. Although retail sales modestly rebounded in the latest report, the three- and six-month averages are negative.
Leading Indicators
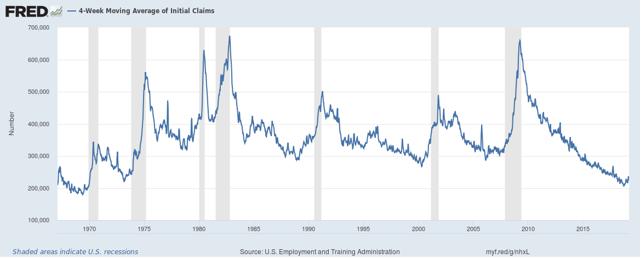
The leading indicators are still flashing yellow, starting with the four-week moving average of initial unemployment claims:
This data typically turns higher 6-12 months before a recession starts.
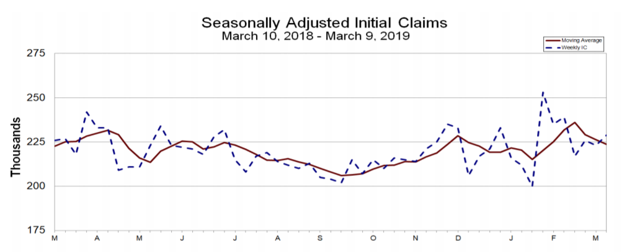
This chart from the Department of Labor's weekly release shows that the four-week MA (in red) hit a low in September and has continued to print modestly higher. The dotted blue line (which shows weekly claims) has been trending higher, which will continue to pull the four-week MA higher.
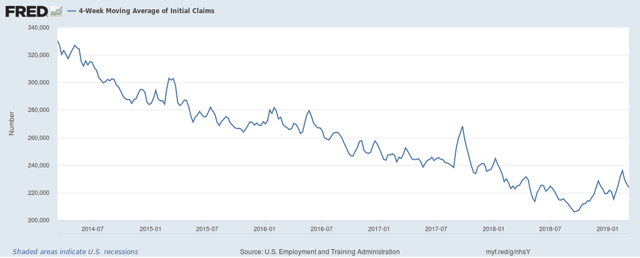
Above is a five-year chart of the four-week MA which shows the downward trend along with the potential reversal in mid-September.
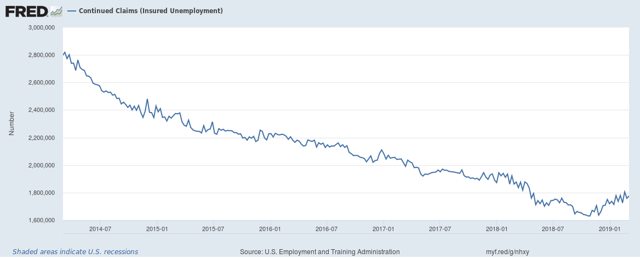
And this week, I'm adding the number of people continuing to receive unemployment claims to the list. This long-term chart shows it has a solid track record of turning before a recession:
Below is a five-year chart of the data. Like the four-week claims for initial unemployment, it appears this data formed a bottom in September and is now moving modestly higher:
The main reason for my bearishness is the yield curve, which continues to act as though we're at the end of an economic cycle.
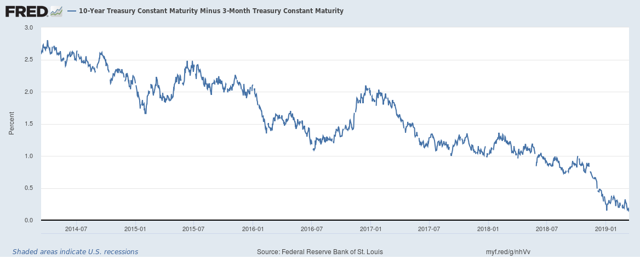 The 10-year-3-month spread continues to be very tight. It is currently below 25 basis points.
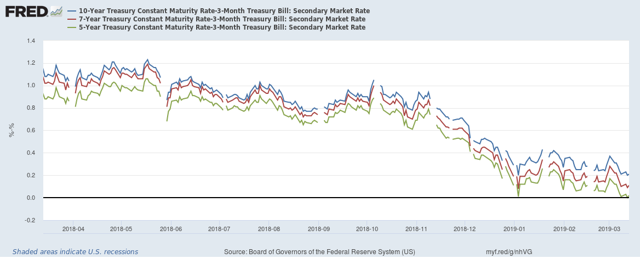
The 10-year-3-month (in blue), 7-year-3-month (in red), and 5-year-3-month (in green) are also very tight. All three are less than 25 basis points.
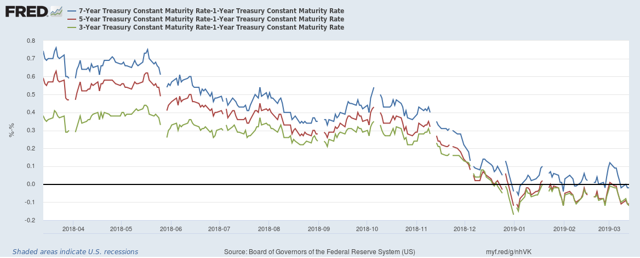
The spread between the 5-year-1-year (in red) and 3-year-1-year (in green) are inverted; the 7-year-1-year continues to flirt with inversion.
Finally, this week the Census released the latest durable goods report, which contains new orders for capital goods excluding aircraft - an indicator of business sentiment. Here is a chart of the M/M and Y/Y percentage change: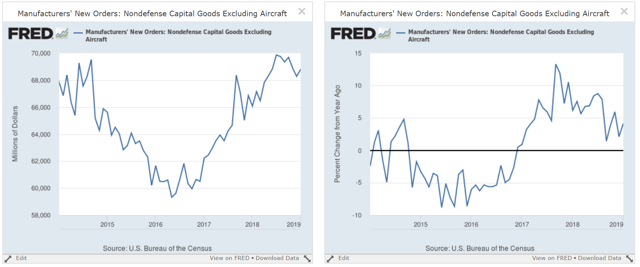
The left chart shows the absolute number, which has decreased in four of the last six months. The right chart shows the Y/Y percentage change. While still positive, it's declining.
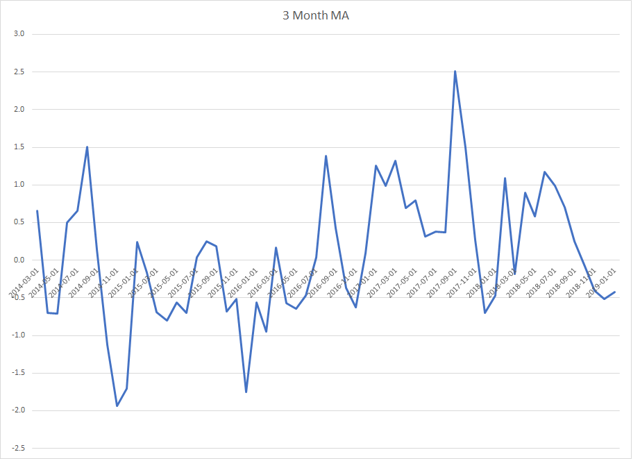
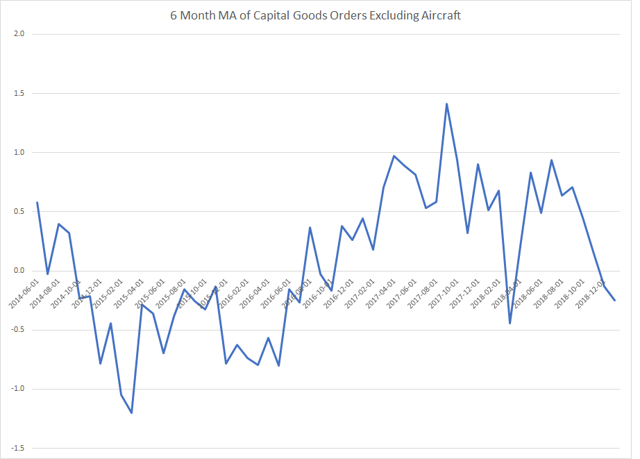
And, the three- and six-month moving averages of the data are declining:
Data from the St. Louis Federal Reserve; Author's Calculations
This number is a bit more volatile, but that's to be expected given it's only for a three-month period. It has been negative for the last three months.
Data from the St. Louis Federal Reserve; Author's Calculations
This data is a bit "calmer" thanks to its longer time frame. It's been negative for the last few months.
Coincidental Indicators
This week, the Census Bureau released the latest data for retail sales. The good news is they increased .2%. The bad news is the preceding drop was revised lower to a 1.6% decline. Here's a look at the data from a few perspectives: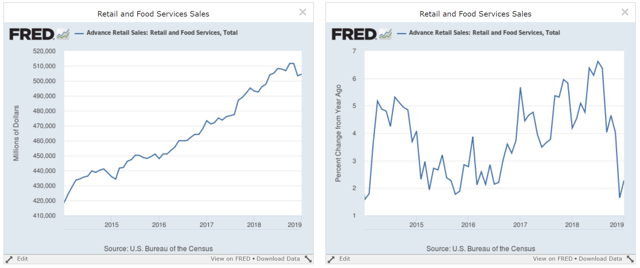
The absolute number is on the left. Since July, there's only been one solid increase. On the right is the Y/Y percentage change, which is clearly declining.
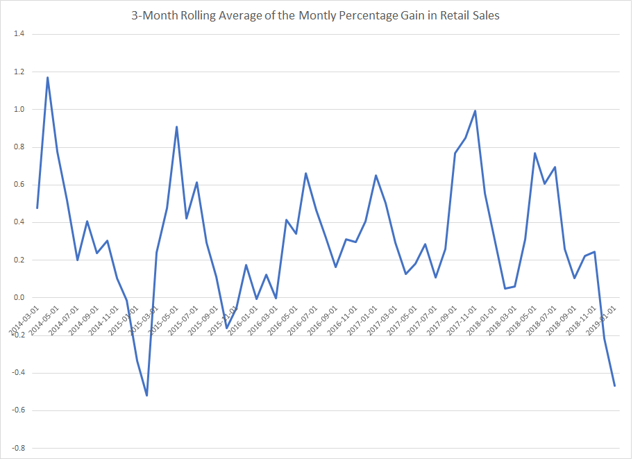
And then we have the moving averages of the monthly gain, which are declining:
Data from the St. Louis Federal Reserve; Author's Calculations
The three-month moving average of the monthly change in retail sales is now negative, as is...
...6-month MA.
Overall, we're still looking at modestly bearish readings in a wide enough swath of data to keep the recession probability in the next 6-12 months at 30%.
Disclosure: I/we have no positions in any stocks mentioned, and no plans to initiate any positions within the next 72 hours. I wrote this article myself, and it expresses my own opinions. I am not receiving compensation for it (other than from Seeking Alpha). I have no business relationship with any company whose stock is mentioned in this article.

