Turning Points For The Week Of June 17-21Summary
- The Fed has all but admitted that the economy is weaker.
- Although building permits increased, the overall trend is lower. The belly of the yield curve continues to invert.
- The moving averages for retail sales and industrial production are both trending lower.
The purpose of the Turning Points Newsletter is to look at the long-leading, leading, and coincidental indicators to determine if the economic trajectory has changed from expansion to contraction - to see if the economy has reached a "Turning Point."
My recession probability remains at 20%. The Fed has all but admitted that the economy is weakening, and it is willing to lower rates to keep the expansion alive. The belly of the yield curve continues to invert. The moving averages of retail sales and industrial production are trending lower - the former at fairly steep rates.
Fed Statements
This week, the Fed met and decided to maintain its current interest rate stance. However, it switched to a more dovish stance. Here's the key text from their statement:
In light of these uncertainties and muted inflation pressures, the Committee will closely monitor the implications of incoming information for the economic outlook and will act as appropriate to sustain the expansion, with a strong labor market and inflation near its symmetric 2 percent objective.
Weaker price pressures mean economic activity is muted, which is further highlighted in the "to sustain the expansion" language. This shouldn't come as a surprise; the Fed noted modest softness in the last Beige Book opening statement:
Economic activity expanded at a modest pace overall from April through mid-May, a slight improvement over the previous period. Almost all Districts reported some growth, and a few saw moderate gains in activity. Manufacturing reports were generally positive, but some Districts noted signs of slowing activity and a more uncertain outlook among contacts. Residential construction and real estate both showed overall growth, but both sectors saw wide variation in sentiment across Districts. Reports on consumer spending were generally positive but tempered. Tourism activity was stronger, especially in the Southeast, but I vehicle sales were lower, according to reporting Districts. Loan demand was mixed but indicated growth. Agricultural conditions remained weak overall, but a few Districts reported some improvements. The outlook for the coming months was solidly positive but modest, with little variation among reporting Districts.
I emboldened a large section, then italicized the hedging words in the report. It seems as though every positive statement is followed by a fairly important qualifier. That indicates the Fed was hearing a fair amount of softness in the anecdotal comments from district contacts.
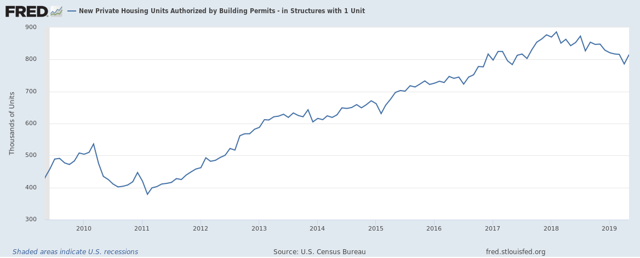
The Census released the latest building permits data, which showed an increase. The overall trend, however, remains lower:
We'd need a few more months of positive data to argue the trend was better.
Finally, the belly of the yield curve continues to be inverted:
The left panel shows the difference between the 10/7/5-year and the 3-month treasury. The overall trend continues to decline and is increasingly inverted. The right pane shows the 7/5/3-year and the 1-year spread, which also continues to become more negative.
Coincidental Data
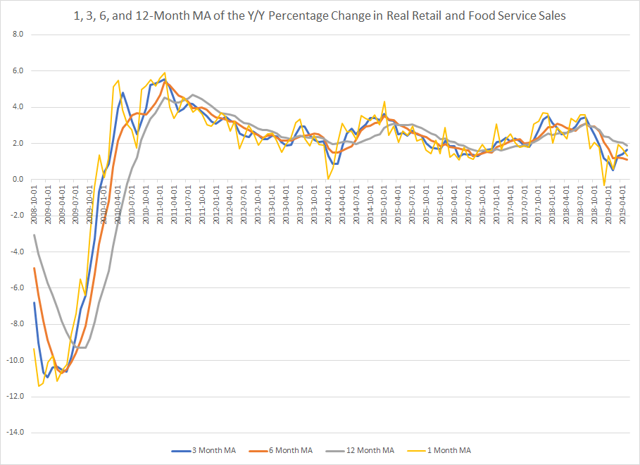
There were no new releases of coincidental data. So, let's look at this in a slightly different light by looking at the moving averages of key releases. We'll start with retail sales:
Data from the St. Louis Fred system; author's calculations
The yellow line is the Y/Y percentage change on a monthly basis. That number was modestly negative at the end of last year. It has since moved higher, but weakly. The latest reading is right at lows from early 2016. The three-month moving average in blue is moving modestly higher, as is the six-month in gold. The 12-month is declining. Overall, this data series is showing its weakest readings of this expansion.
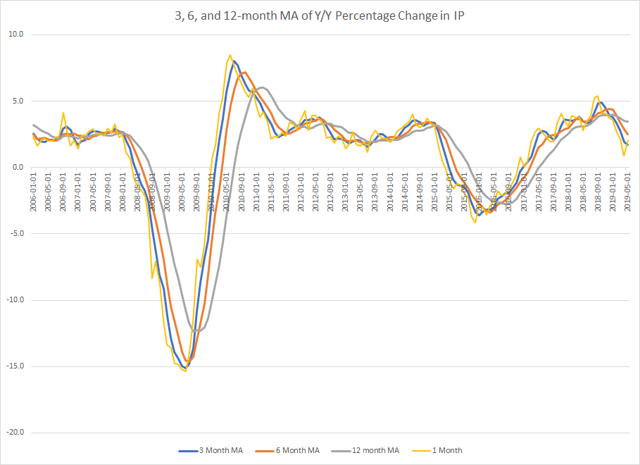
Industrial production turned negative in 2015-2016 due to the oil market collapse. It rebounded after the election, rising to its highest levels of expansion at the end of last year. All the moving averages, however, are now moving lower. Monthly increases have been weak during the last six months: it's contracted three times, gained 0% in a fourth and was up .1% in a fifth. Last month's .3% increase was the strongest reading since the end of last year
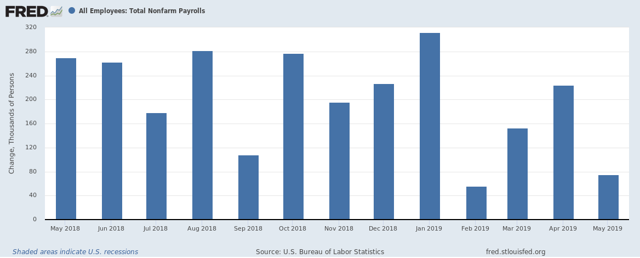
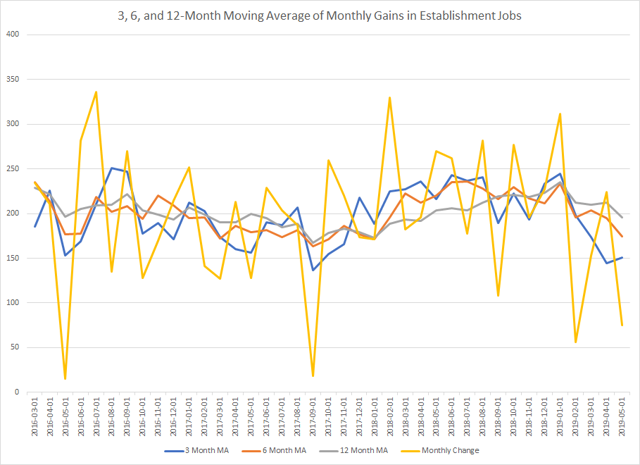
Above is a chart of the monthly gains in establishment jobs. Notice the modest declining trend. It started in September 2018, resumed in February and then again in May. The trend is especially prevalent over the last four months.
Data from the St. Louis Fred system; author's calculations
The above chart shows the 3-month (in blue), 6-month (in orange), and 12-month (in gray) moving average of the monthly gain in establishment jobs. The overall pace is still solid. It is however softer.
The coincidental numbers are softer, as best shown in the moving averages. There's a solid softening trend in retail sales and industrial production. Monthly job gains are declining as well.

