
Summary- Orders for capital goods ex-transportation have declined in four of the last five months.
- The four-week moving average of initial unemployment claims continues to increase.
- Two coincidental indicators dropped in their latest reports.
The purpose of the Turning Points Newsletter is to look at the long-leading, leading, and coincidental indicators to determine if the economic trajectory has changed from expansion to contraction - to see if the economy has reached a "Turning Point."
My recession probability in the next 6-12 months remains at 25%. New orders for non-defense capital goods have declined in four of the last five months, and the four-week moving average of initial unemployment claims continues to move higher. The yield curve continues to behave in a standard, end-of-cycle manner with the curve narrowing and the belly of the curve modestly inverting. Industrial production and retail sales dropped sharply last week.
Leading Indicators
This week, the Census Bureau released the latest durable goods report. While the headline number was once again bullish (up 1.2%), the number ex-transportation was weak, increasing .1%. This number has been flat for seven months. More importantly, non-defense capital goods orders appear to be peaking. Here is a chart of the entire data series: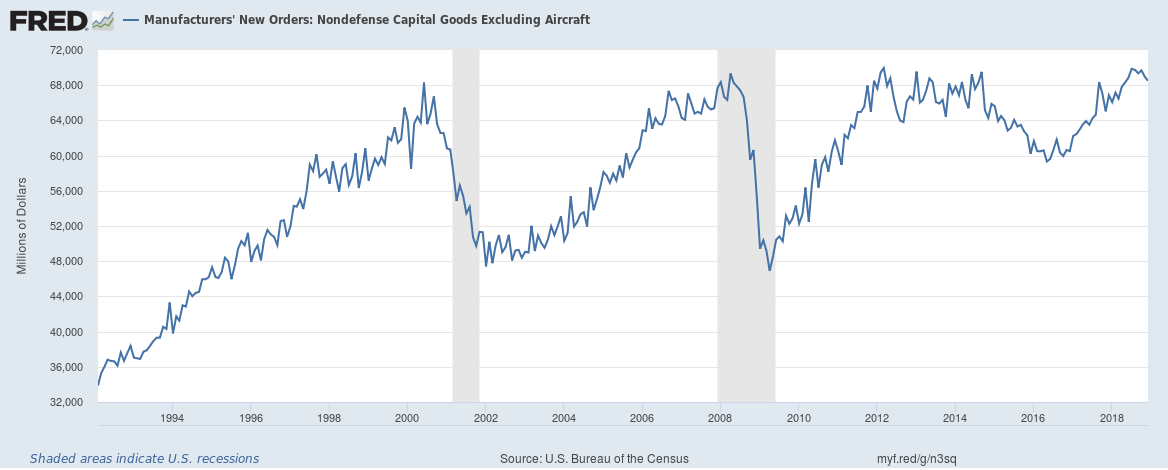
It topped near $68 billion in each of the last three cycles and is currently just shy of $70 billion. More importantly, it has declined in four of the last five months, as shown in the following graph: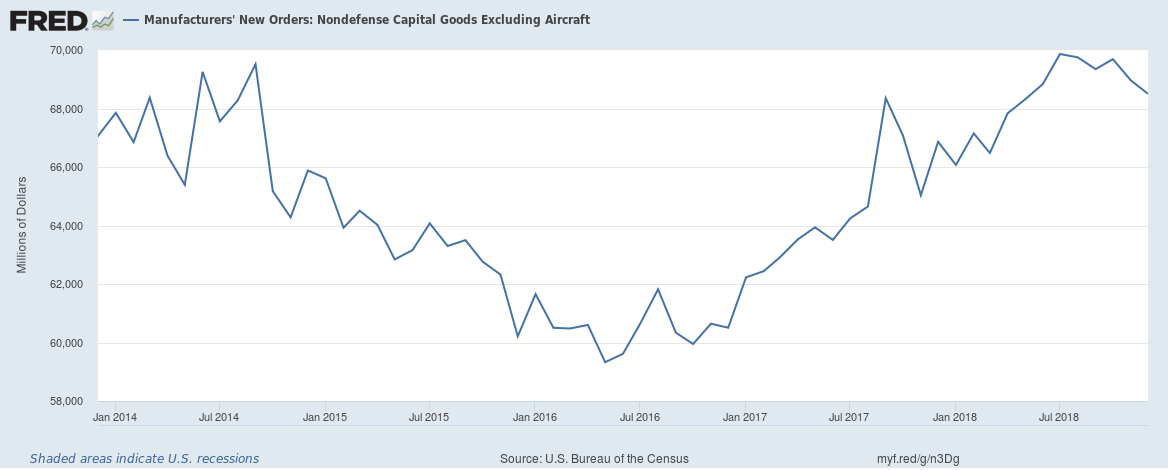
Five months is a mini-trend. This series is influenced by corporate sentiment, which has been weak of late (from the latest Fed Minutes; emphasis added):
Some participants highlighted that recent surveys of business sentiment or District contacts had indicated some weakening in optimism or confidence about the economic outlook, though available indicators suggested that the level of business sentiment had remained high. Concerns about the economic outlook were variously attributed to uncertainty or worries about slowing global economic growth, including in Europe and China; trade policy; waning fiscal policy stimulus; and the partial government shutdown. Manufacturing contacts in a number of Districts indicated that such factors were causing them to delay or defer capital expenditures. In addition, a few participants noted that recent declines in oil or gasoline prices had damped plans for capital expenditures in the energy sector. A few participants observed that conditions in the agricultural sector remained difficult, citing large inventories of agricultural commodities, uncertainty about international trade policies, and concerns regarding low prices of commodities and farmland.
Last week, I noted that the four-week moving average of initial unemployment claims reached a low in September and has since continued rising. That trend continued this week:
The data series starts to rise between six and nine months before a recession. Should this trend continue, we could have a very powerful signal.
The yield curve continues to act in an "end-of-the-cycle manner." Most importantly, the curve continues to narrow, as shown in this graph:

The chart depicts the spread between the 10-year-3-month Treasury bill. I've multiplied the figure by -1 to invert the graph. Right now, we're right below the 0% line. Other parts of the curve continue to narrow:
Above are the spreads between the 10-year-3-month (in blue), the 7-year-3-month (in red), and the 5-year-3-month (in green). The widest is a mere 35 basis points, while the tightest is ~15 basis points.
Finally, the trend of inversions in the belly of the curve continues:

The 5-1 and 3-1 spreads remain below 0, meaning they're inverted. The 7-1 spread continues to flirt with crossing that line.
Coincidental Indicators
Last week, we learned of weak data results in retail sales and industrial production. From the Census (emphasis added):
Advance estimates of U.S. retail and food services sales for December 2018, adjusted for seasonal variation and holiday and trading-day differences, but not for price changes, were $505.8 billion, a decrease of 1.2 percent (±0.5 percent) from the previous month, but 2.3 percent (±0.5 percent) above December 2017.
From the Federal Reserve (emphasis added):
Industrial production decreased 0.6 percent in January after rising 0.1 percent in December. In January, manufacturing production fell 0.9 percent, primarily as a result of a large drop in motor vehicle assemblies; factory output excluding motor vehicles and parts decreased 0.2 percent. The indexes for mining and utilities moved up 0.1 percent and 0.4 percent, respectively. At 109.4 percent of its 2012 average, total industrial production was 3.8 percent higher in January than it was a year earlier.
One month does not make a trend. It's also fairly possible that we're seeing negative fallout from the rough economic backdrop in December and January, during which the markets dropped and the government experienced its longest shutdown. That doesn't change the fact that two coincidental indicators dropped in the same month, a condition we'd expect to see as we near a recession.
Finally, while not a formal coincidental indicator, consider the following about downside risks from the latest Fed Minutes (emphasis added):
Participants commented on a number of risks associated with their outlook for economic activity, the labor market, and inflation over the medium term. Participants noted that some risks to the downside had increased, including the possibilities of a sharper-than-expected slowdown in global economic growth, particularly in China and Europe, a rapid waning of fiscal policy stimulus, or a further tightening of financial market conditions. An increase in some foreign and domestic government policy uncertainties, including those associated with Brexit, an escalation in international trade policy tensions, and the potential for additional extended federal government shutdowns were also cited as downside risks. A few participants expressed concern that longer-run inflation expectations may be lower than levels consistent with the Committee's 2 percent inflation objective. Several participants judged that risks that could lead to higher-than-expected inflation had diminished relative to downside risks. The potential that various sources of uncertainty might abate more quickly than expected was mentioned as a potential upside risk for the economic outlook.
That's a great deal of risk to consider. And it's all warranted.
Disclosure: I/we have no positions in any stocks mentioned, and no plans to initiate any positions within the next 72 hours. I wrote this article myself, and it expresses my own opinions. I am not receiving compensation for it (other than from Seeking Alpha). I have no business relationship with any company whose stock is mentioned in this article.