Who is Kevin Hassett? Wolfe looks at the Trump ally tipped to become Fed Chair.
Summary
- The credit markets continue to flash warning signs.
- The 4-week moving average of initial unemployment claims, while low, has been rising since mid-September.
- The moving averages of establishment job growth are still strong. There is some modest weakness in a few sub-categories of establishment growth, however.
The purpose of the Turning Points Newsletter is to look at the long-leading, leading, and coincidental indicators to determine if the economic trajectory has changed from expansion to contraction - to see if the economy is at a "Turning Point."
To review, I've pegged the recession odds in the next 12-18 months at about 30%. This is based on weakening building permits, weak global equity markets, the impact of increasing interest rates, and somewhat weaker credit markets. Yesterday, we received news that the Fed is considering a pause in its rate hike strategy after one last 25 basis point increase in December. While this is welcome news, it takes 6-12 months for rate hikes to move through the economy, so we'll be dealing with the effect of its rate increases for all 2019.
Let's start with the leading indicators:
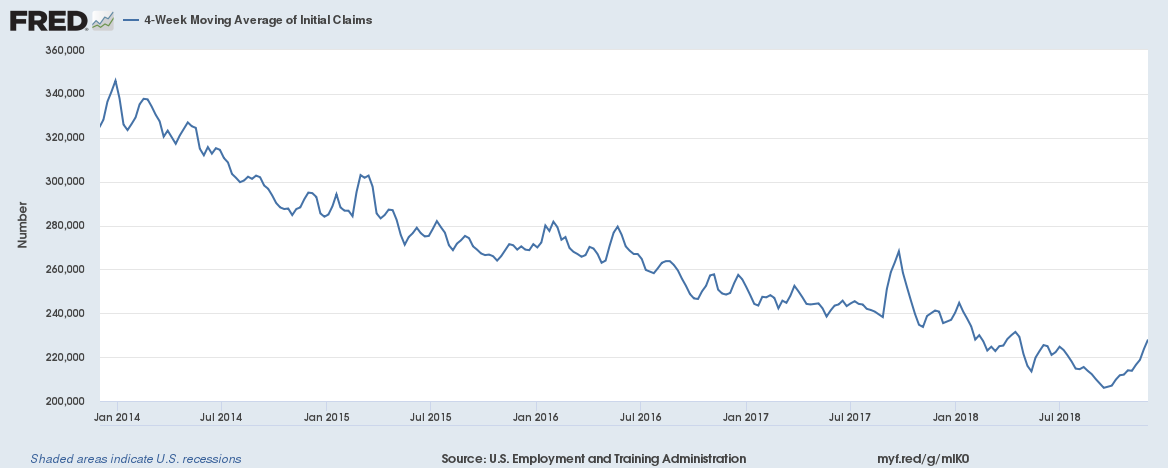
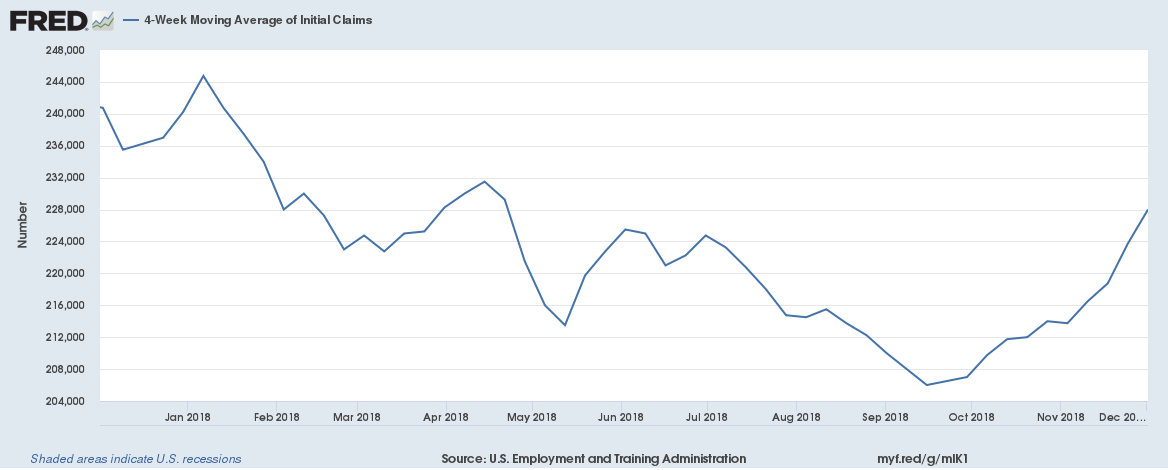
The two charts above depict the 4-week moving average of initial unemployment claims. The top chart's time frame is five years, during which the trend is clearly lower. The bottom chart's time frame is one year, and it shows that since mid-September, the 4-week moving average has been in a clear uptrend. It's too soon to call this a reversal; we'll need at least another month of data to make that call. However, this is the longest consistent rise in the last five years, so it bears monitoring.
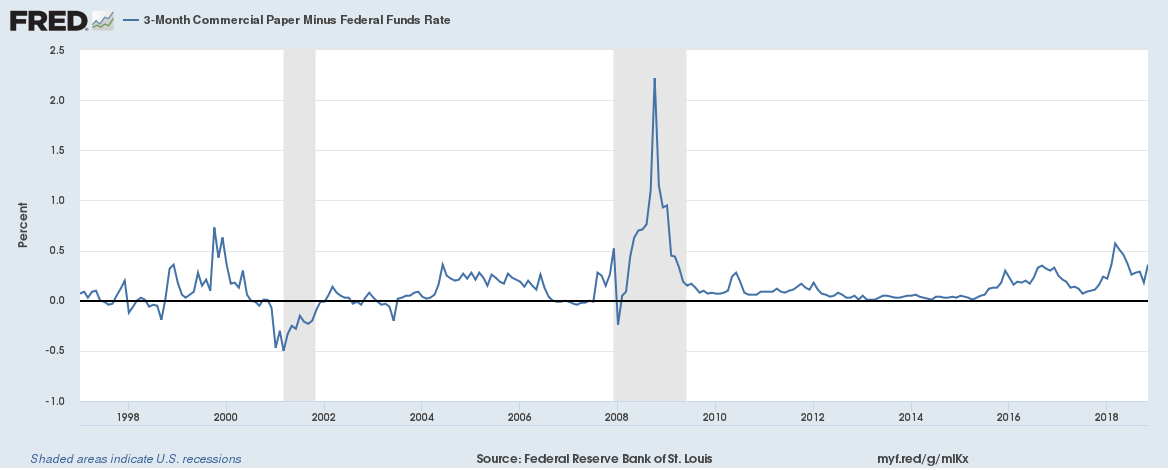
The credit markets typically start exhibiting problematic behavior 12-24 months before the economy starts contracting. The first credit market metric that caused concern was commercial paper, which remains somewhat elevated:
Recent increases in CCC yields (caused by the drop in oil prices) have added to the problems:
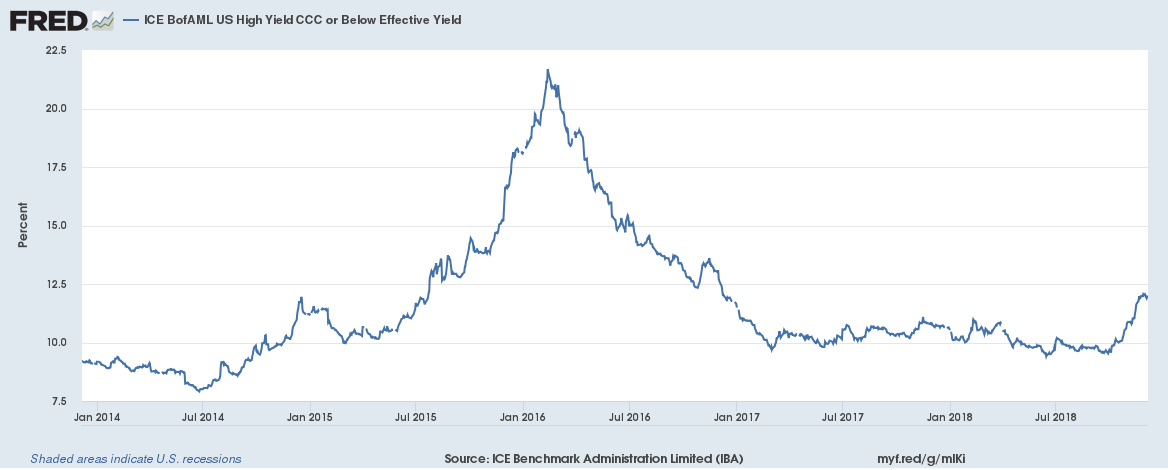
The good news is in the above chart is that yields appear to have topped out recently. But BBB yields have continued to increase and are now near 5-year highs: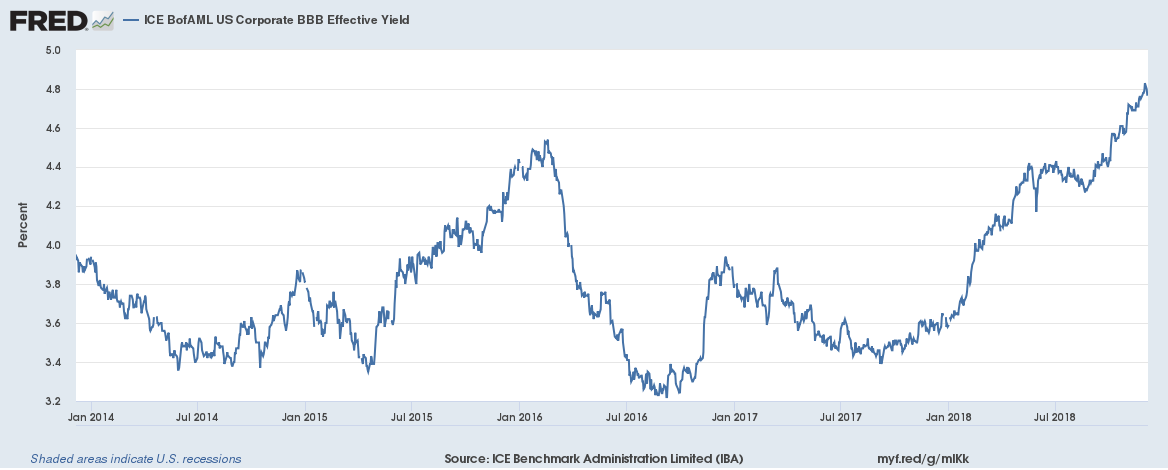
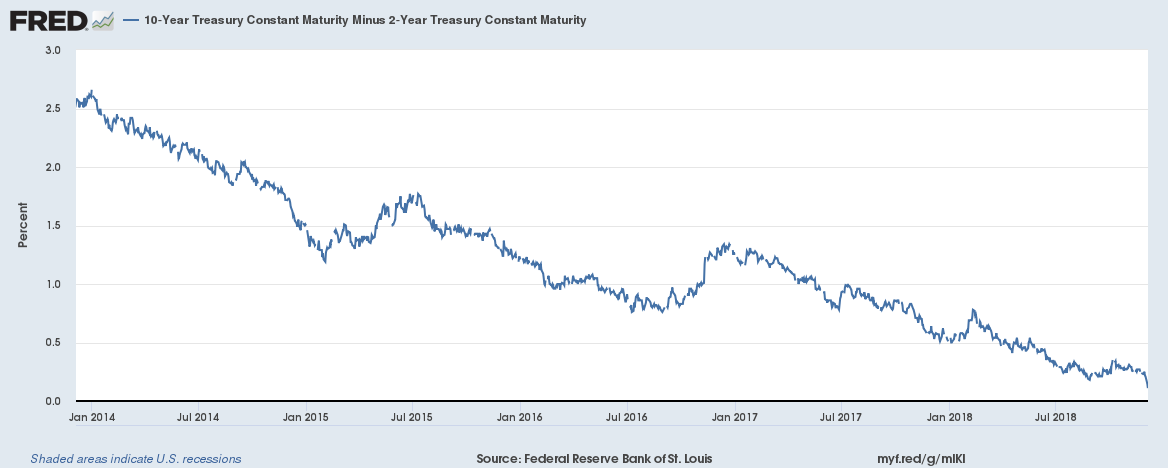
This has been accompanied by a continual compression of the Treasury market. The 10-2 spread is now below 25 basis points:
And the 10 year-three month spread continues to contract as well: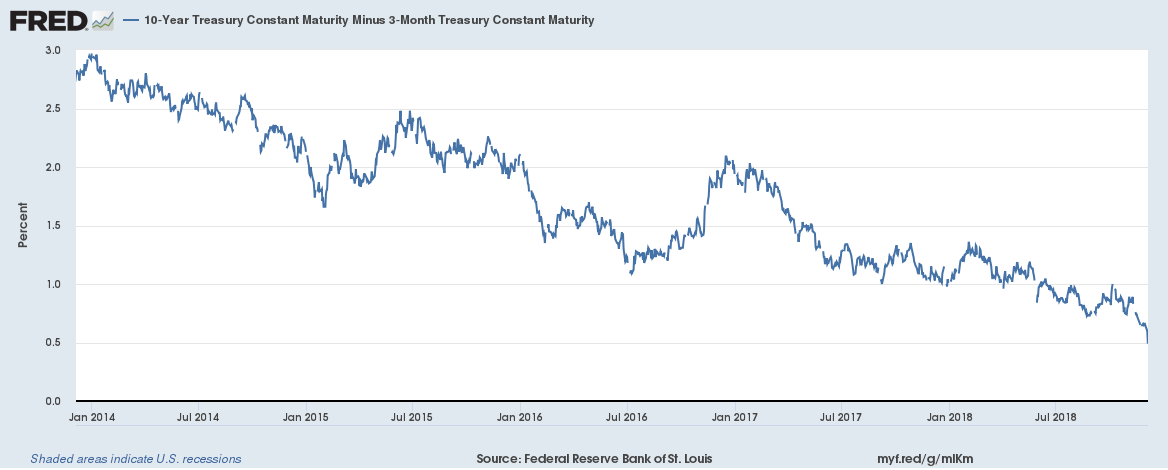
On the plus side, this weakening across the credit spectrum has not severely impacted the various financial stress indexes, all of which remain at un-concerning levels: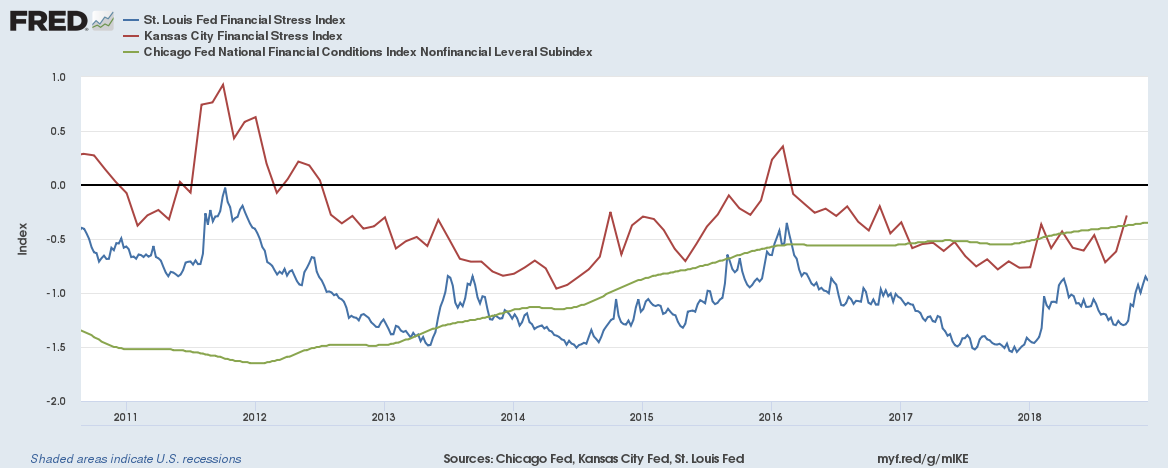
But the overall increase in yields across a variety of ratings and maturities is sufficient to raise a yellow flag.
Leading indicators conclusion: A post-December pause in the Fed's rate hike policy would be welcome and is probably warranted especially with interest rate sensitive economic sectors (housing and auto sales) somewhat weaker. But the rate hikes are still working their way through the economy, so their impact is ongoing. That combined with the rising weakness in the bond market is enough to raise caution flags going forward.
Turning to the coincidental numbers, we have the latest employment report. From the BLS:
Total nonfarm payroll employment increased by 155,000 in November, and the unemployment rate remained unchanged at 3.7 percent, the U.S. Bureau of Labor Statistics reported today. Job gains occurred in health care, in manufacturing, and in transportation and warehousing.
The monthly numbers are tremendously noisy, which is why I prefer to use 3-, 6-, and 12-month moving averages: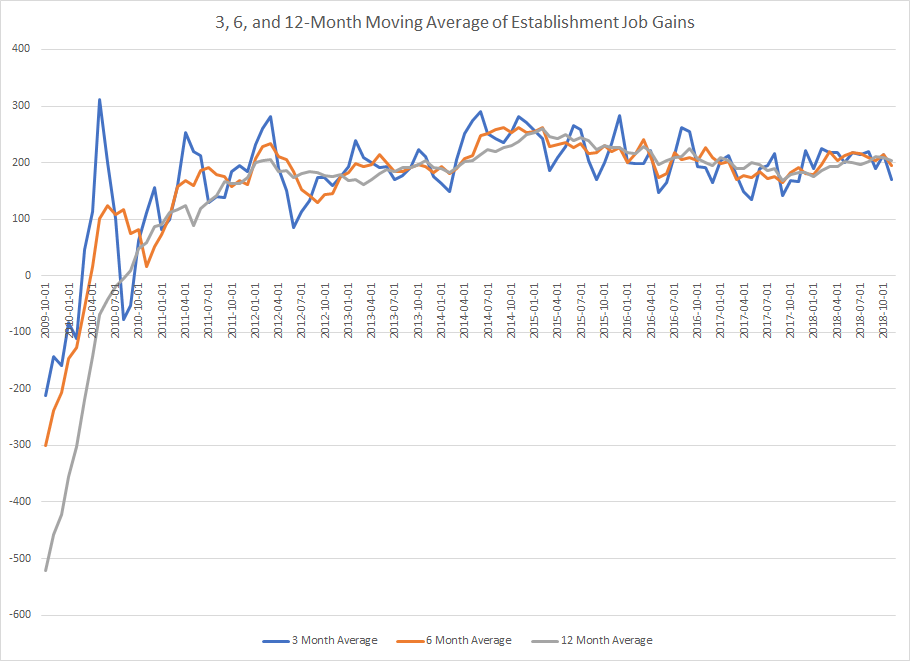
(Data from the St. Louis FRED system; author's calculations)
The 3-, 6- and 12-month moving averages are 170,000, 195,000, and 204,000, respectively. The 3-month number dropped 44,000, but that shouldn't be surprising due to the sharp drop in the headline number and short-term nature of the measurement. The 6- and 12-month numbers are still very strong. The best part of this news is that it will bolster the dovish Fed argument.
Let's look at a few charts from the report's sub-categories: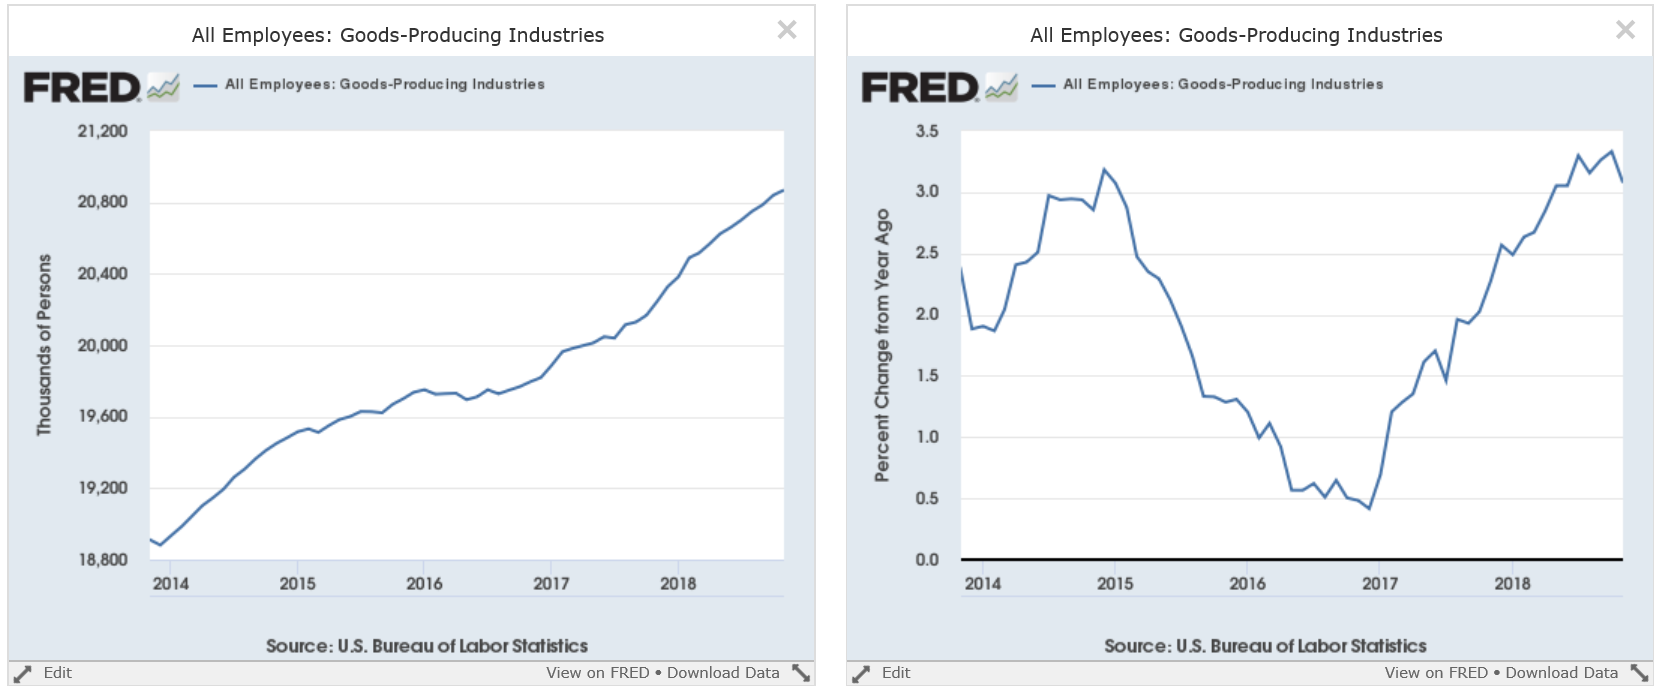 Although it's a small section of the establishment jobs market, the total number of goods production jobs continues to increase (left chart). However, the Y/Y percentage change appears to be plateauing (right chart).
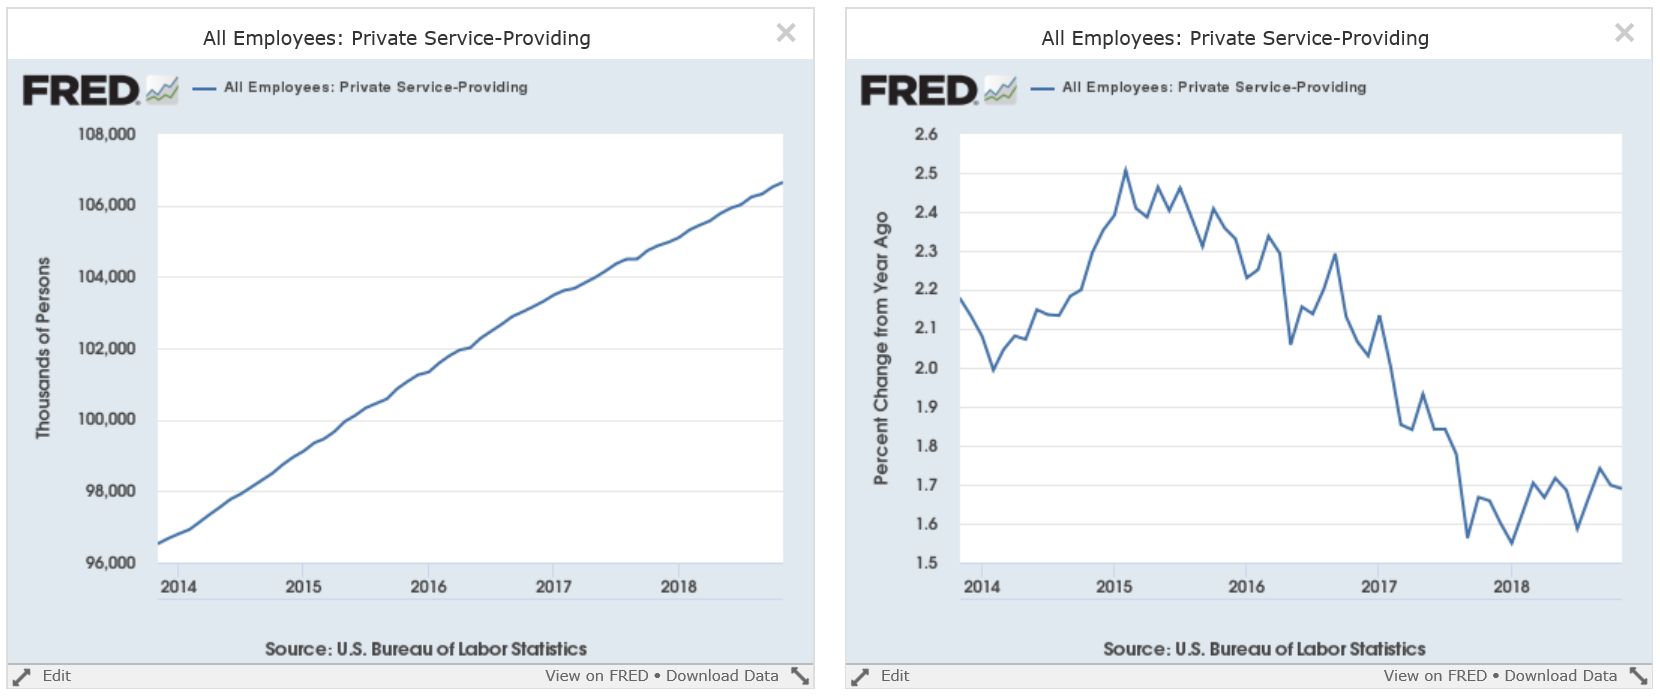 While the absolute number of service jobs continues to increase (left chart), the Y/Y percentage increase is lower, largely as a function of basic math; the absolute number of jobs would have to continue increasing at a fast clip to keep the Y/Y pace higher.
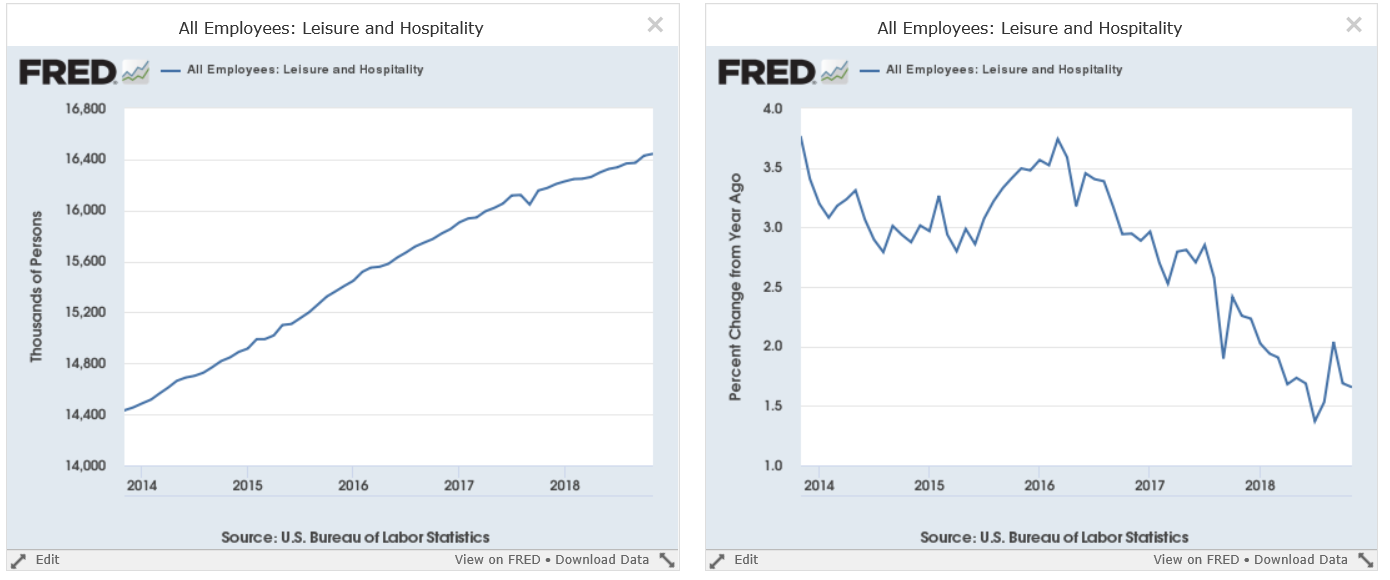
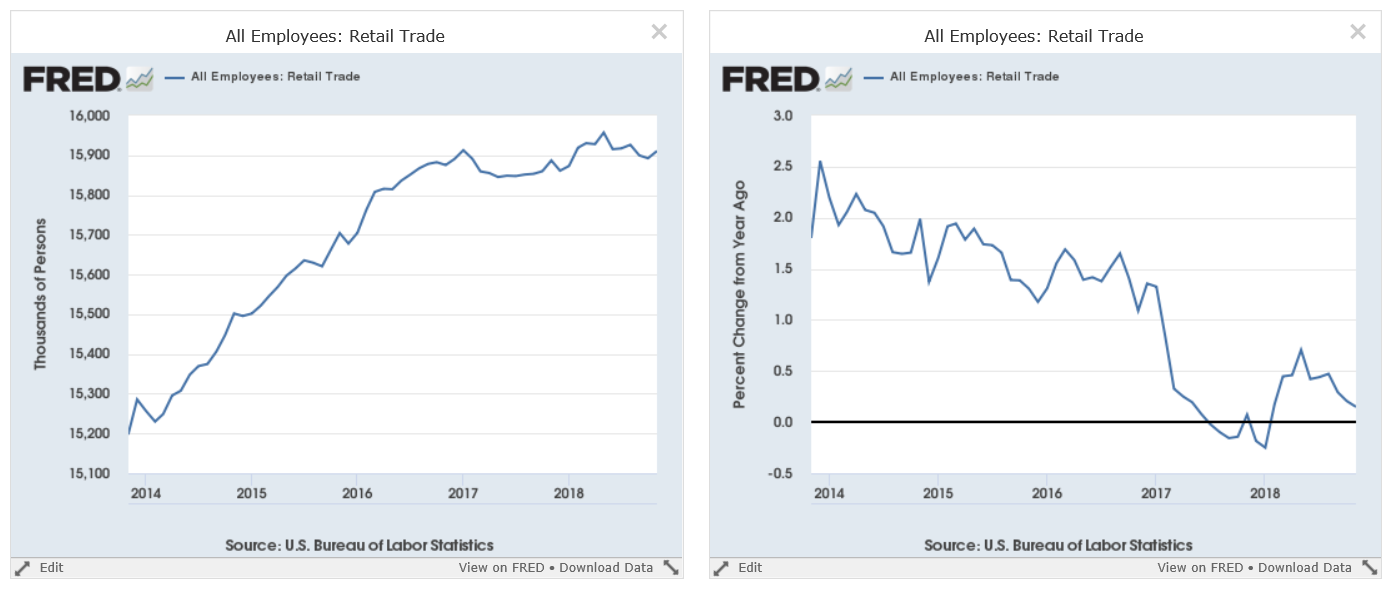 Leisure and hospitality jobs (top two charts) and retail sales jobs (bottom two charts) are weaker. While the number of retail jobs continues to increase, the Y/Y pace is declining. Retail sales jobs have been moving sideways for a few years, which means the Y/Y pace of growth has been declining.
Coincidental numbers conclusion: I'm less concerned about the monthly miss than most, largely due to the inherent volatility of these numbers. There is some modest weakness in a few data sub-categories of the data, but nothing fatal. I am curious if the rise in the 4-week moving average of initial claims discussed in the leading indicators section is now bleeding into establishment data. We'll need a few more months of reports to draw an initial conclusion.
While the coincidental numbers are still fine, the rise in credit market issues keeps my recession probability for the next 12-18 months at 30%.
Disclosure:I/we have no positions in any stocks mentioned, and no plans to initiate any positions within the next 72 hours.
I wrote this article myself, and it expresses my own opinions. I am not receiving compensation for it (other than from Seeking Alpha). I have no business relationship with any company whose stock is mentioned in this article.
