Investing.com’s stocks of the week
Leading indicators
The yield curve continues to issue warning signs. This week we had a mild inversion in the "belly of the curve" (the 2-10 year sector):
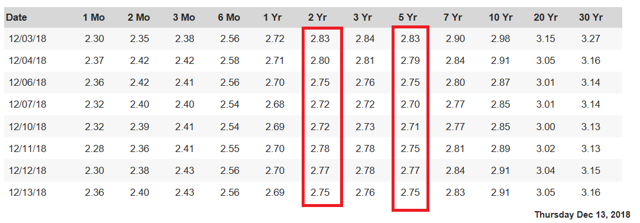
The 2-Year was a few basis points above the 5-Year for several days (as was the 3-Year), which is better shown on this graph: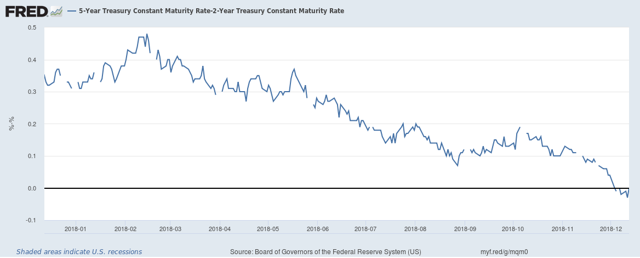
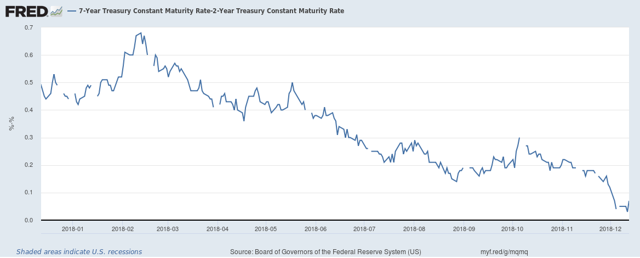
The 7-Year to 2-Year spread continues to narrow:
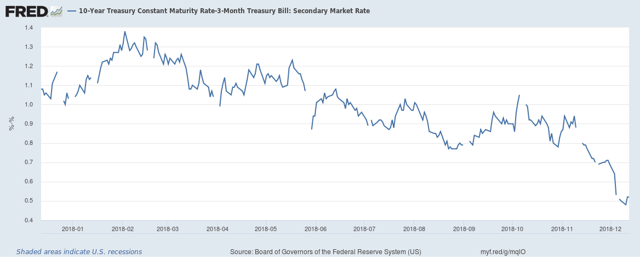
As does the 10-Year to 3-Month spread:
Finally, the long-end of the curve is starting to come in with the 30-Year to 10-Year spead:
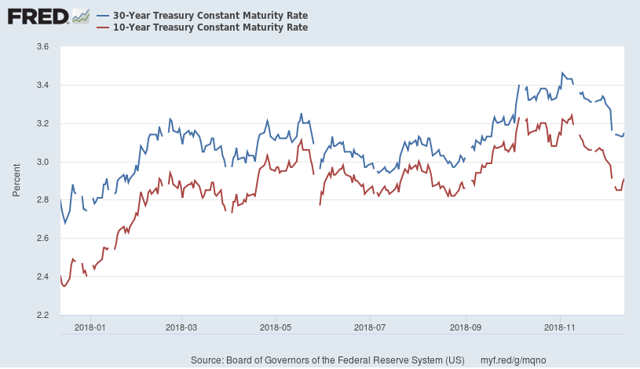
Both the 30-Year and 10-year Treasury yield has fallen; the former by about 15 basis points, the latter about 20. This means that over the last month, investors see less growth and therefore less inflation.
As a result of the Fed raising interest rates and the long-end of the curve tightening, the total yield spread of the curve is now about 75 basis points:
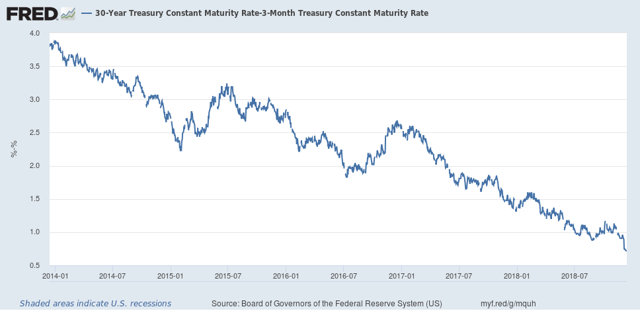
What we have is the classic end-of-the-expansion yield curve scenario. The Fed is raising rates to maintain inflation expectations and contain inflation. This is starting to slow growth, keeping inflation low, making the long-end of the curve attractive. Hence, investors are buying 10- and 30-year Treasuries. The overall effect is to narrow the curve.
Coincidental Indicators
The Census issued the latest retail sales report [emphasis added]:
Advance estimates of U.S. retail and food services sales for November 2018, adjusted for seasonal variation and holiday and trading-day differences, but not for price changes, were $513.5 billion, an increase of 0.2 percent (±0.5 percent)* from the previous month, and 4.2 percent (±0.5 percent) above November 2017. Total sales for the September 2018 through November 2018 period were up 4.3 percent (±0.5 percent) from the same period a year ago. The September 2018 to October 2018 percent change was revised from up 0.8 percent (±0.5 percent) to up 1.1 percent (±0.2 percent).
Let's place this data into historical context:
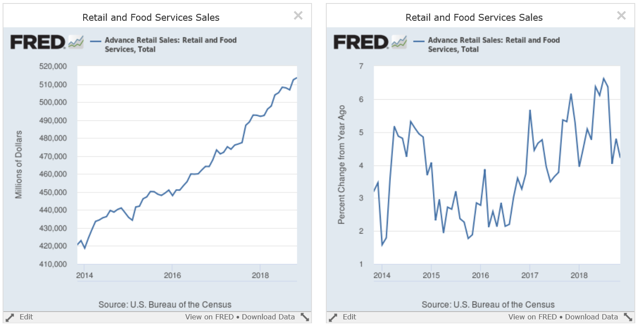
The left chart has the absolute number while the right is Y/Y. The left number continues to move in a SW-NE direction - a solid uptrend. The Y/Y rate is slightly above 4%, where it's been for all this year.
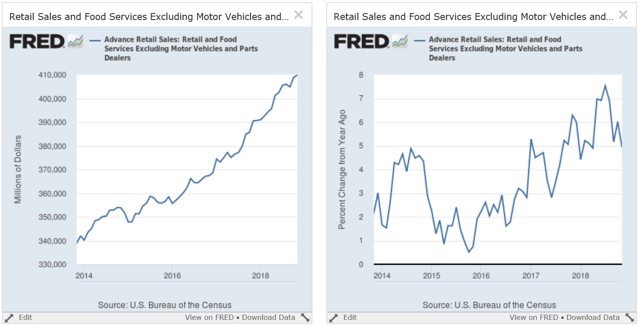
We see the same pattern in the numbers ex-autos, except that the Y/Y pace is at 4.9%.
There are two areas of concern in the data, starting with auto sales:
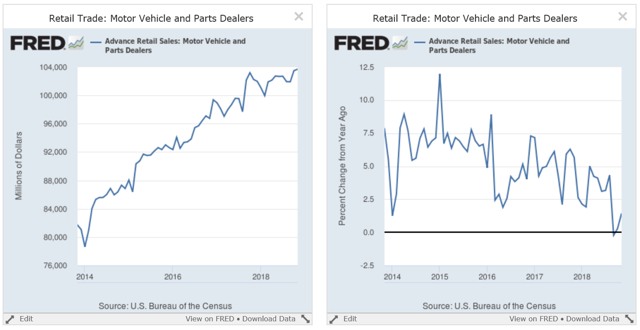
Auto sales have probably peaked for the cycle. They were moving sideways (left chart) for most of 2018 while the Y/Y number continues to move lower (right chart).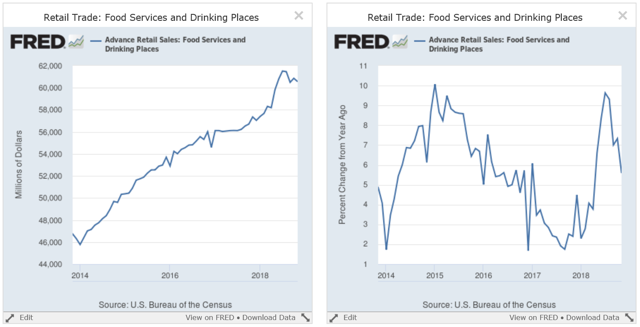
Restaurant sales grew strongly in the first half of the year; they have since moved lower. The Y/Y pace has been like a yo-yo this year.
Next, the Federal Reserve released the latest industrial production numbers. Here is the table from the report:
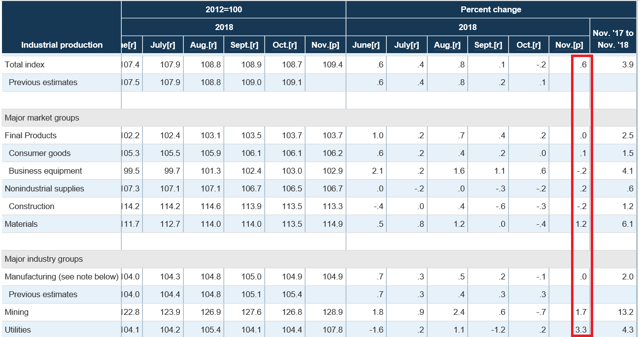
The headline number was positive. However, the details are less impressive. Manufacturing was flat (lower panel), and as were final products; non-industrial supplies rose .2% (top panel). These are only one month of numbers; however, all of these sub-categories have been advancing nicely over the last year. The real gains were in mining (oil extraction) and utility output.
Conclusion
The good news is that two coincidental numbers remain strong. However, the partial inversion of the yield curve is very worrying. The long-end coming in is a classic end-of-cycle development, as is the narrowing of the entire curve. I'm keeping my recession probabilities at 30%.
Disclosure: I/we have no positions in any stocks mentioned, and no plans to initiate any positions within the next 72 hours. I wrote this article myself, and it expresses my own opinions. I am not receiving compensation for it (other than from Seeking Alpha). I have no business relationship with any company whose stock is mentioned in this article.
