Summary- Corporate earnings are softer.
- The belly of the yield curve is still inverted; 1-unit building starts are softer.
- While retail sales have improved, industrial production is still weak.
The purpose of the Turning Points Newsletter is to look at the long-leading, leading, and coincidental economic indicators to determine if the economic trajectory has changed from expansion to contraction -- to see if the economy has reached a "Turning Point."
Takeaway: I've still got a 20% recession probability in the next 6-12 months. Corporate earnings are still softer, although they're not in full-blown contraction territory. The yield curve is still behaving in a standard end-of-cycle manner while 1-unit building permits are still trending lower. While retail sales have rebounded, industrial production is still softer.
Long-Leading Indicators
Not only is earnings season underway, but on Friday the BEA will release the latest GDP report which will contain corporate profit information. We also have preliminary information about the latest earnings releases, from Zacks (emphasis added):
...no major surprises on the growth front, which we knew will be anemic. We should keep in mind however that the growth challenge is more a function of tough comparisons to last year’s record results than a cyclical downturn in profitability.
While comparisons are tough (tax cuts from late 2017 had their maximum impact on corporate earnings during 1H18), there have been numerous anecdotal reports detailing executive concern about the macro environment, specifically trade-related issues. While anecdotal information can't be quantified, there has also been a noticeable slowdown in capital expenditures over the last year, which is direct evidence of anemic sentiment:
... estimates for 2019 Q3 are coming down more than what we saw in the comparable period for the June quarter.
Always take earnings projections and estimates offered by companies with an incredibly large grain of salt. They have ample reason to massage these numbers. Still, the core message is that earnings are coming down, which is a net negative.
Leading Indicators
According to the latest Census Bureau report, 1-unit building permits increased last month (emphasis added):
Privately‐owned housing units authorized by building permits in June were at a seasonally adjusted annual rate of 1,220,000. This is 6.1 percent (±1.2 percent) below the revised May rate of 1,299,000 and is 6.6 percent (±1.1 percent) below the June 2018 rate of 1,306,000. Single‐family authorizations in June were at a rate of 813,000; this is 0.4 percent (±1.0 percent)* above the revised May figure of 810,000.
Here's a chart of the data:
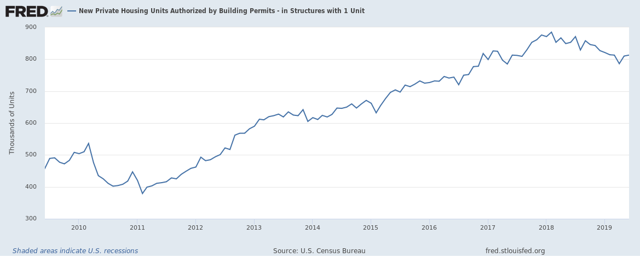
While the data has increased in the last two months, the overall trend remains lower -- a trend that started at the beginning of 2018 and which is still occurring. Add to that the general bullish nature of the data underlying the housing market: the jobs market is very strong, wages are rising, the wealth effect is in full force, and interest rates are low. In other words, one could argue that the data should be stronger.
And then we have the yield curve:
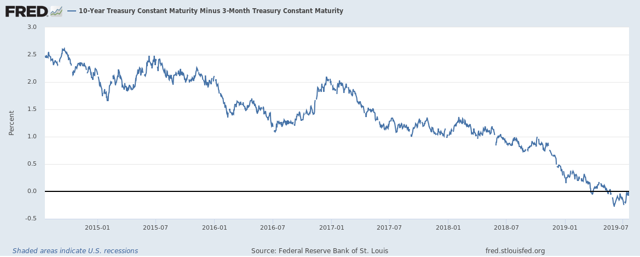
The 10-Year/3-Month spread has continued lower and has been negative for about the last month.
And the belly of the curve has been inverted for longer:
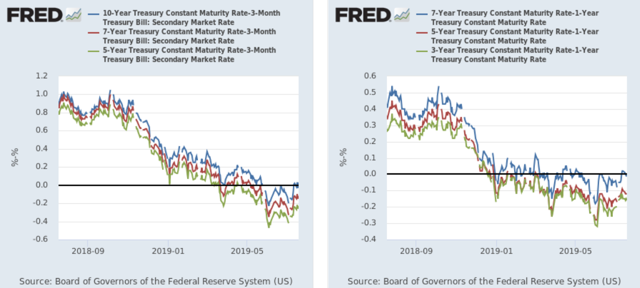
The left chart shows the spread between various mid-maturity Treasury bonds and the 3-month while the right chart shows the spread between various mid-term maturities and the 1-year. Both charts have been heading lower since last year. The left chart inverted in the spring while the right charts inverted at the end of last year/beginning of this year.
Leading indicators conclusion: the data is still soft. Despite two months of modest increases, 1-unit housing starts are still trending lower. And the yield curve is still in a classic pre-recession structure.
Coincidental Indicators
Last week, there were two coincidental indicator releases: retail sales and industrial production.
Retail sales were positive (emphasis added):
Advance estimates of U.S. retail and food services sales for June 2019, adjusted for seasonal variation and holiday and trading-day differences, but not for price changes, were $519.9billion, an increase of 0.4 percent (±0.5 percent)*from the previous month, and 3.4 percent (±0.7 percent) above June 2018. Total sales for the April 2019 through June 2019 period were up 3.4 percent (±0.5 percent) from the same period a year ago. The April 2019 to May 2019 percent change was revised from up 0.5 percent (±0.5 percent)*to up 0.4 percent (±0.2 percent).
Here's a chart of the data:
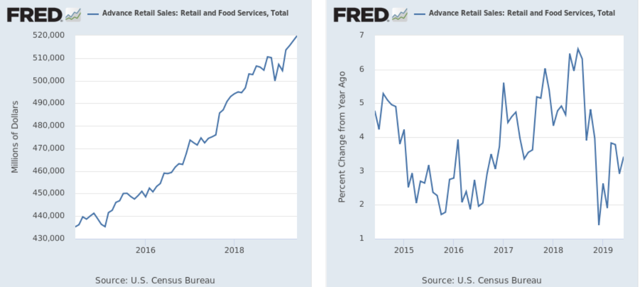
After dipping in 4Q18-1Q19, they have rebounded (left chart). While the Y/Y pace is weaker (right chart), it's still positive.
Industrial production, however, is still a concern. Here's the table from the Fed's report:
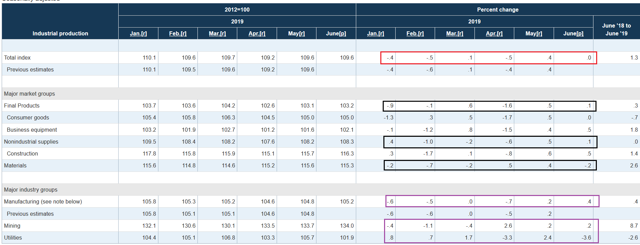
There are three color schemes above: red for the total IP number (top row), black for major market groups (second set of boxes) and purple for major industry groups (third set of boxes). There is weakness in all data sets. The topline number (in red) declined in three of the last six months and was unchanged in a fourth. Of the major market groups (second set of data in black), final products were down in half of the last six months. Note the weak reading for business equipment, which shows weak business sentiment. Non-industrial supplies contracted in three of the last six months while materials production was off four times since January. Looking at the industry groups (in purple), we see the same level of weakness: in the last six months, manufacturing and mining were down half the time. No matter how you sub-divide the data, there's softness.
Here's a chart of the data:
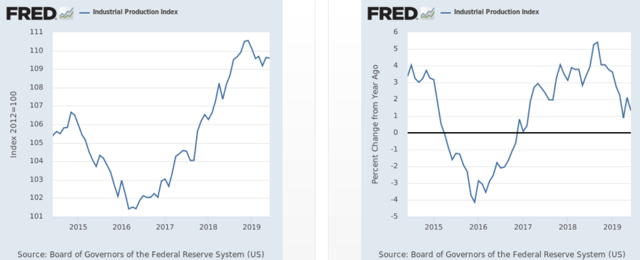
The left chart shows the absolute level, which has tapered off since the end of 2018. The right chart shows the Y/Y percentage change, which is also trending lower.
Coincidental numbers conclusion: retail sales have bounced back, indicating that that the strong jobs market is translating into increased consumer spending. Industrial production, however, continues to be weak. The trend has been occurring for the last six months, indicating it's not only a trend but could indicate an increasing level of underlying weakness.
Overall, there is still enough weakness in the indicators to support a 20% recession probability in the next 6-12 months.
