Here's the regular 5 macro technical charts (going as far as individual commodities, currencies, bonds, and sectors, as well as the rest of the major indexes and benchmarks). No comments on anything except the technical/price developments (albeit we will typically cover the broader case in the Weekly Macro Themes where the technical and fundamental set up produce a compelling investment idea). Even if you're not technical analysis minded it's a useful way to keep on top of trends in some of the main financial markets and as a prompt for further investigation...
In this edition we look at the longer term uptrend in copper prices, the symmetrical triangle pattern in US 10-year Treasury yields, overbought Indian equities and their resistance line, a potential breakout in gold prices, and a look at some reasons why the VIX may be headed higher soon!
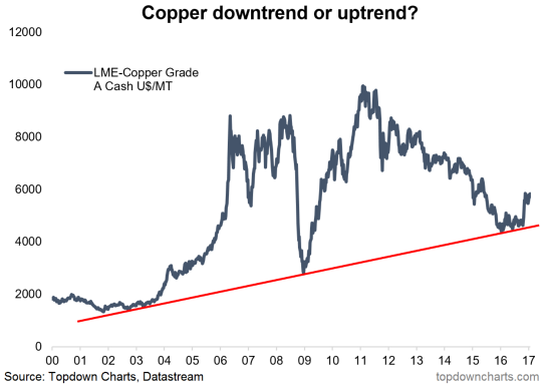
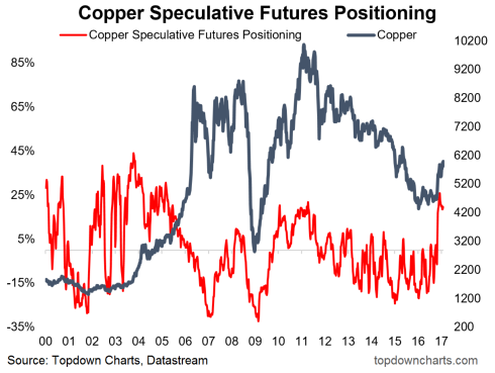
1. Copper - Is it really in an uptrend?
- Looking at the past 5 years, copper looks to be in a downtrend
- Looking at the past 15 years, copper looks to be in an uptrend with touches of the trendline in 2003, 2008, and 2016; each interpretation has a very different meaning for the outlook.
- Speculative futures positioning looks stretched, but in the same way as in the early 2000s. I talked about this and the outlook for base metals in the latest edition of the Weekly Macro Themes.
Overall technical view: Bullish bias medium-long term horizon.
2. US Treasuries - Symmetrical triangle
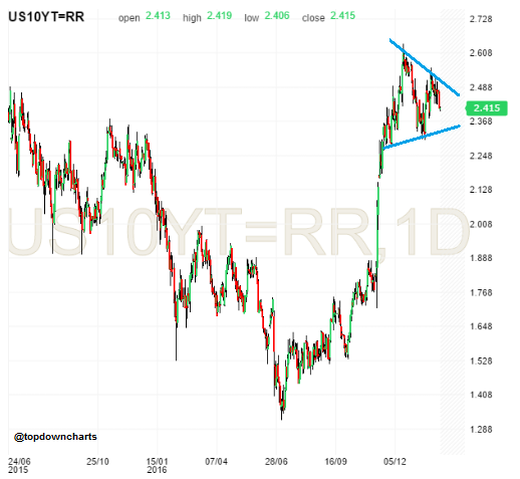
- US 10-year Treasury yield is trading in a symmetrical triangle on the daily chart.
- A symmetrical triangle can serve as a reversal or continuation pattern depending on the breakout.
- US 10-year Treasuries continue to trade in limbo, with neither the major upside resistance (2.60) or downside support (2.30) levels breached thus far.
Overall technical view: Neutral, wait for break of the triangle (and add on break of support/resistance).
3. Indian Equities - Overbought against resistance
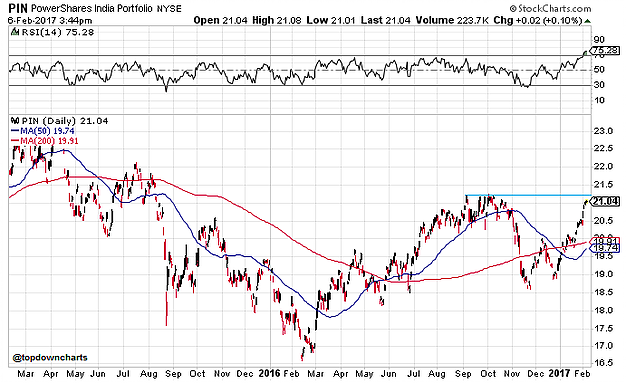
- Indian equities (via PowerShares India Portfolio (NYSE:PIN)) look short-term overbought with the RSI above 70 following a sharp rise.
- At the same time price is coming up against resistance.
- The 50dma is coming close to crossing over the 200dma (a golden cross) and such a signal is common during the start of a new uptrend.
Overall technical view: Short-term cautious given proximity to resistance and overbought signals, but a breakout would signal the start of a new uptrend and bull market.
4. Gold - Resistance
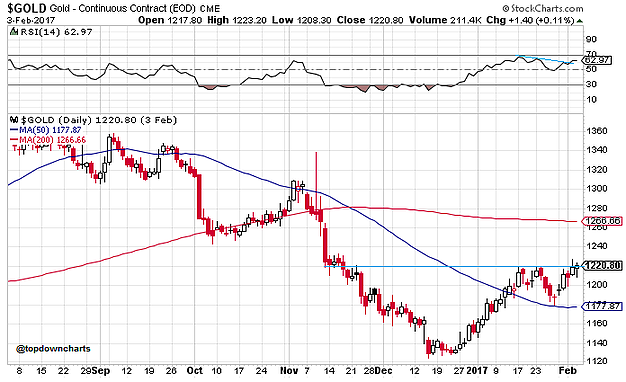
- Gold looks to be in the process of breaking out through the 1220 resistance point, the RSI also appears to have snapped its brief bout of bearish divergence.
- Successful breakout will put the 200dma in play and potential further move higher.
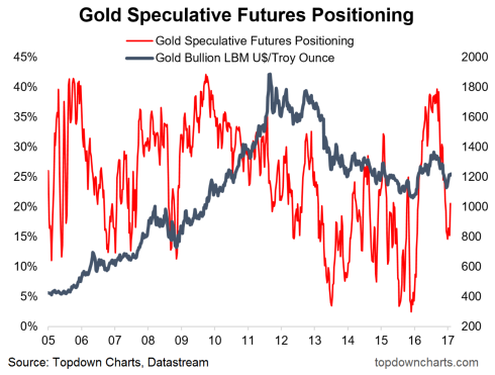
- At the same time, speculative positioning is moving higher after putting in a higher low, as also noted in the latest Weekly Macro Themes (which also covered commodities as an asset class).
Overall technical view: Bullish bias, but on watch for any signs of a failed breakout.
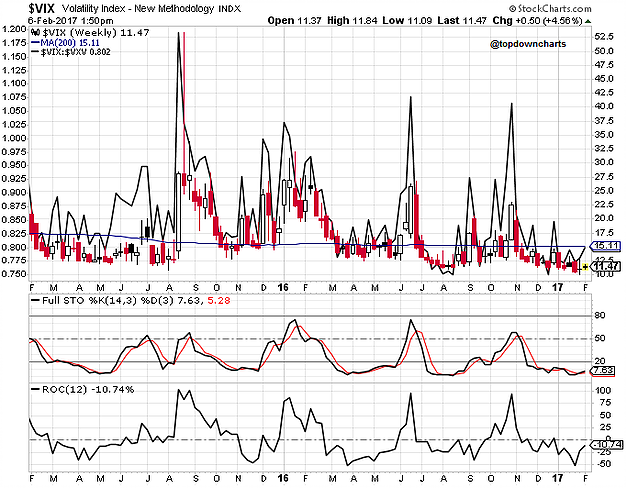
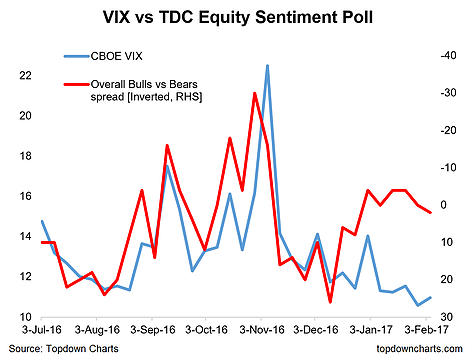
5. VIX - A little too quiet...
- The CBOE VIX index continues to test the lows.
- Signals from the futures curve (VIX vs VXV), rate of change (ROC) and Stochastics (STO) and position vs 200dma all suggest a low point is in and the odds for a move higher are rising.
- -The weekly equity sentiment poll is also continuing to show a divergence vs the VIX, and this is the kind of divergence that will usually close at some point or other.
Overall technical view: All signals point rising odds of a VIX spike.
