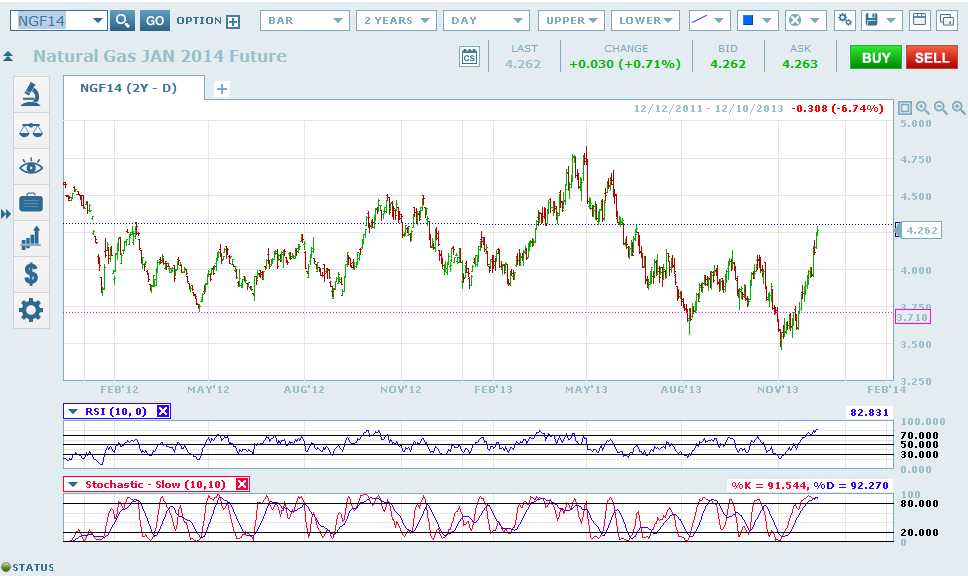
Here's a two year look at Natural Gas prices. To my eyes, the range looks like $4.25/$4.30 on the high end and $3.75/$3.70 on the low end. This morning Jan Nat Gas futures traded to nearly $4.29.
- For technical types, the 6/19/2013 high tick was $4.295.
- The 10 day RSI on a daily chart is 83.
- The slow stochastics looks primed to roll over.
My colleague, Greg Adamsick wrote an excellent piece yesterday about Natural Gas prices and the significant competitive advantage in the United States. He regularly puts out insightful commentary and has forgotten more about Fixed Income markets than I'll ever know. If you want to receive his market missives, let one of us know.
Back to Nat. Gas. I would recommend short deltas in January or February options that fit your specific risk profile. Consider short calls (unlimited risk). Short call spreads (defined risk). Long ratio put spreads (unlimited risk on downside). Short futures with a stop. Short futures and short a put (or two) for premium "protection".
Fundamentally, prices above $4.00 incent many producers to put Rigs back to work. You can follow the action on the ground and in the water with Baker Hughes weekly rig count data (put out on Friday).
The US drilling rig count jumped 12 units to reach 1,775 rigs working in the week ended Dec. 6, Baker Hughes Inc. reported.
Nine from that total were land-based rigs, which reached a total of 1,696. Rigs drilling offshore increased 4 units to 61. Rigs drilling in inland waters lost 1 unit to 18.
Gas rigs added 8 units to reach a total of 375 while oil rigs gained 6 units to 1,397. Rigs considered unclassified dropped 2 units to 3 units working.
Directional drilling rigs edged up a single unit to 223. Horizontal drilling rigs jumped 10 units to 1,137.
In Canada, a tally of 17 more units brought the country’s total for the week to 402. Oil rigs comprised most of that gain, collecting 15 more units from a week ago to 230. Gas rigs claimed 2 more units to reach 172.
Major states, basins
Productive weeks in Texas and Oklahoma headlined changes in the major oil- and gas-producing states. An 8-unit gain in the Lone Star State gave it a total of 842 rigs working. A 5-unit rise in Oklahoma lifted its total to 180. California was up 2 to 37. West Virginia, Utah, and Alaska each added a single unit to 35, 28, and 9, respectively. Unchanged from a week ago were New Mexico at 78, Wyoming at 57, Ohio at 35, Kansas at 30, and Arkansas at 11. North Dakota and Colorado ended the week down 1 unit each, with respective counts of 167 and 66. Louisiana, at 110, and Pennsylvania, at 53, were both off this week by 2 rigs each.
Movement in the major US basins included a 3-unit boost to the Permian to 473 and a 2-unit addition to the Haynesville to 40. A few states lost 1 unit, including the Eagle Ford at 226, Williston at 179, Marcellus at 86, and DJ-Niobrara at 48
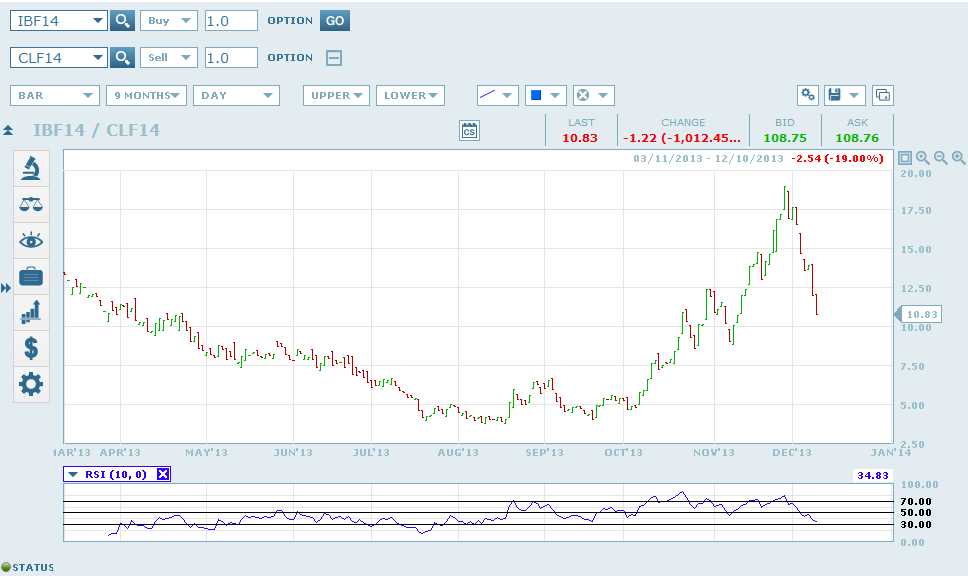
Finally,if you're playing at home and got short the Brent v. WTI spread at some point in the past few weeks when I argued it was stretched......consider taking some off. A bird in hand...... (same goes for shorts in the Heat or Gasoline crack).
Here's the Brent v. WTI chart

