
Foreign Exchange Price and Time at a Glance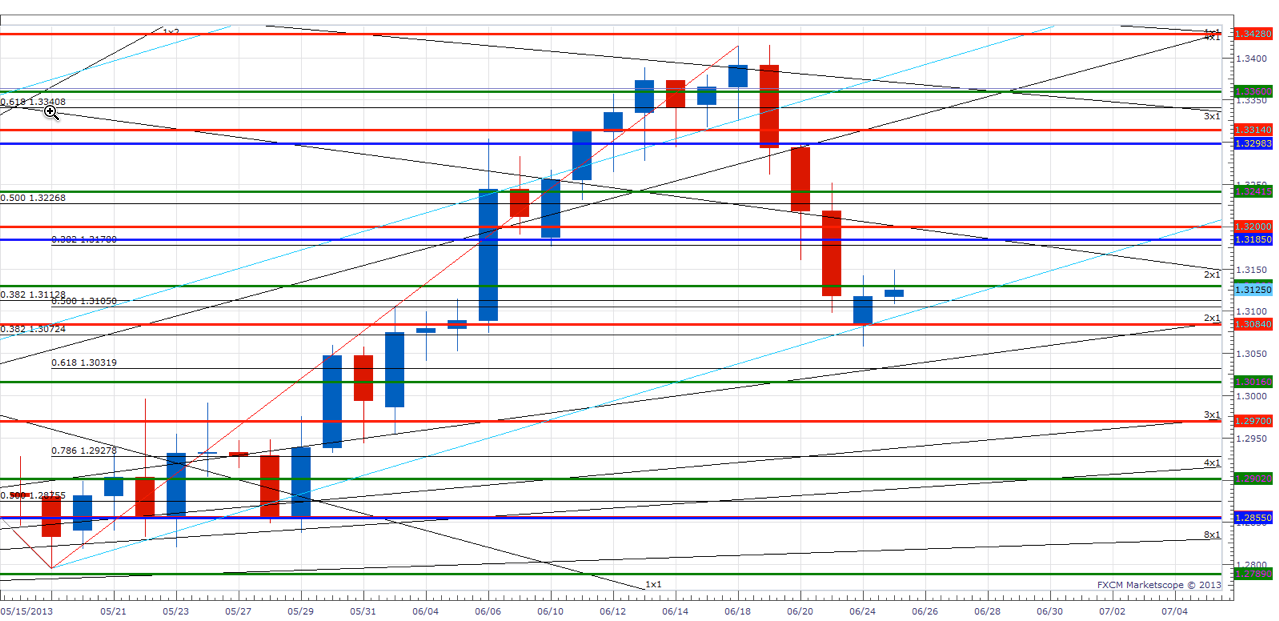 EUR/USD" width="1279" height="621">
EUR/USD
failed last week just below the 6th square root progression of the year-to-date low and has since come under steady downside pressure
- Our trend bias is now lower, but a clear breach of the 1.3030 area (convergence of 2x1 Gann angle line of year’s low and 61.8% retracement May to June advance) is required to set off a more important decline
- Near-term focused cycle studies suggest a minor turn window is in effect over the next day or two
- The 2x1 Gann angle line from the year-to-date high near 1.3200 is immediate resistance
- However, only clear strength above 1.3335 turns us positive on the single currency
: Like adding to short positions on the expected strength over the next couple of days.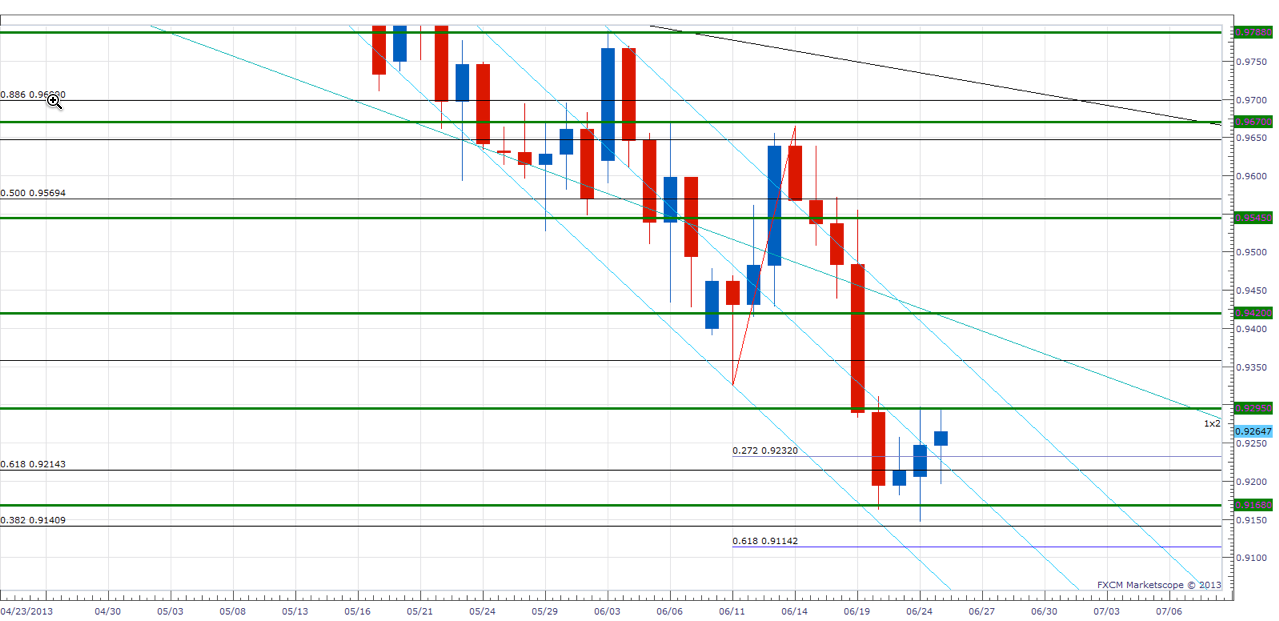 AUD/USD" width="1279" height="621">
AUD/USD traded to its lowest level since 3Q2010 on Monday before rebonding just ahead of the 38% retracment of the advance from the 2008 low to the 2011 high in the .9135 area
- Our trend bias is lower in the Aussie, but extreme caution is required around .9135 as such long-term retracement levels have a greater propensity to spark changes in trend
- A longer-term turn window is in effect this week in the Aussie
- The 12th square root progression of the year-to-date high in the .9295 area is immediate resistance
- However, only strength over .9425 confirms a more important shift in trend
: Like being flat around the big support level. May look to get long if the rate can muster a close above .9295.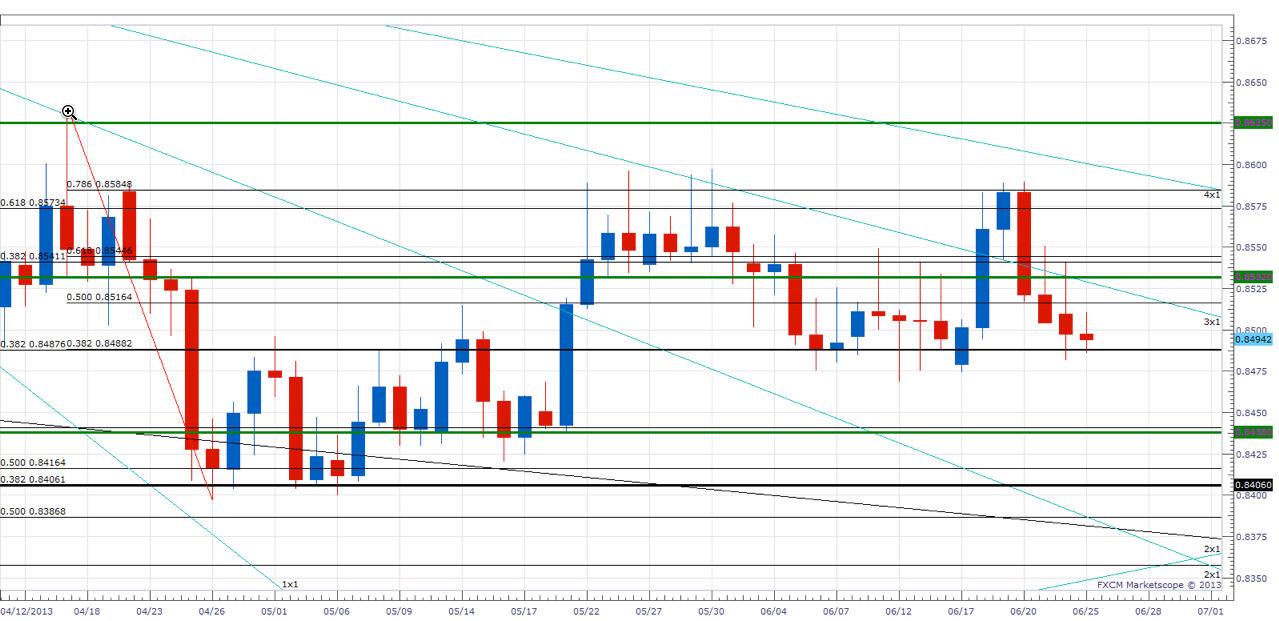 EUR/GBP" width="1279" height="621">
EUR/GBP failed again last week at the 78.6% retracement of the April range in the .8585 area
- Our trend bias is now lower, but weakness below the .8440 4th square root progression of the year-to-date high is really needed to suggest that a more important decline is underway
- The range in the cross has muddled the cycle outook, near-term counts seem to favor strength over the next couple of days
- The .8585 area remains an important resistance
- However, strength over the 2nd square root progression of the year-to-date high at .8625 is needed to trigger a more important trend shift
: Until the range is eclipsed we have little directional conviction.
Daily Focus Chart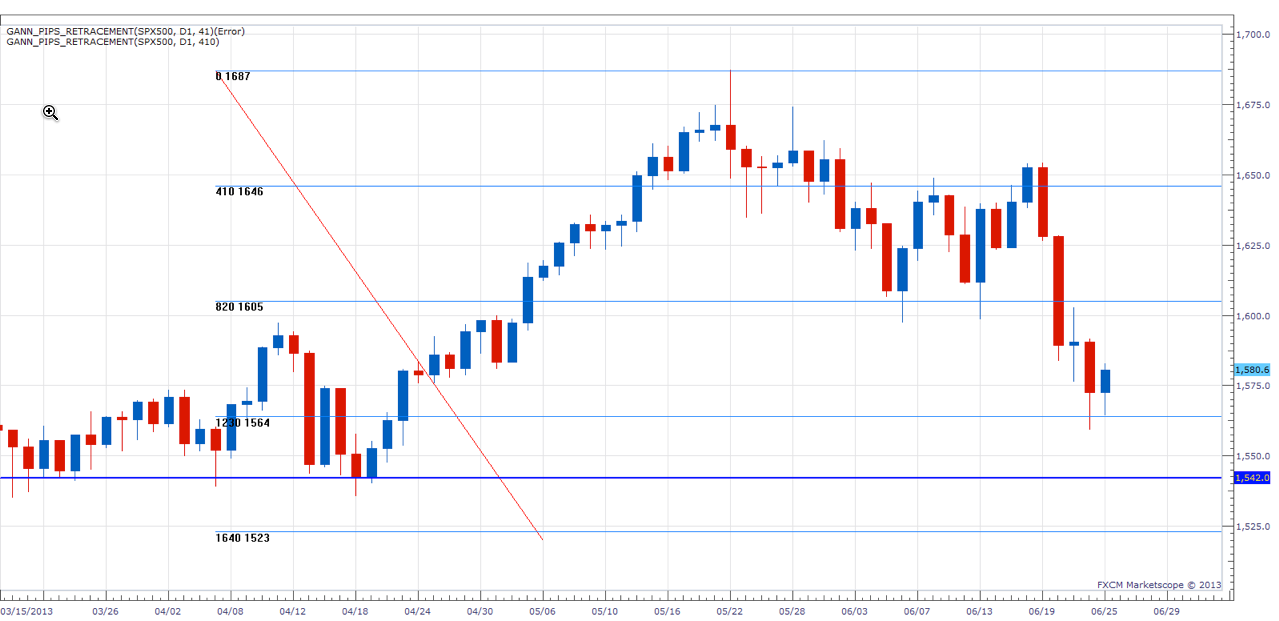
There is good symmetry in the S&P 500 at 1565 as this marks a convergence of the 3rd square root progression from the year-to-date high and the 100% projection of the May decline. Monday’s aboutface from just under this key support level during the cycle turn window suggests this may have been the reversal we have been looking for. Continued strength over 1592 and then 1605 will be further confirmation of a bottom. Fibonacci symmetry also exists around 1542 and with Tuesday being the final day of the turn window we cannot completely rule out a final move lower to test it -- though it does look unlikely. We should note that any new cycle lows beyond Tuesday would be very negative for stocks from a cyclical perspective and signal a more important change in trend is afoot.
by Kristian Kerr, Senior Currency Strategist for DailyFX.com.