EUR/USD
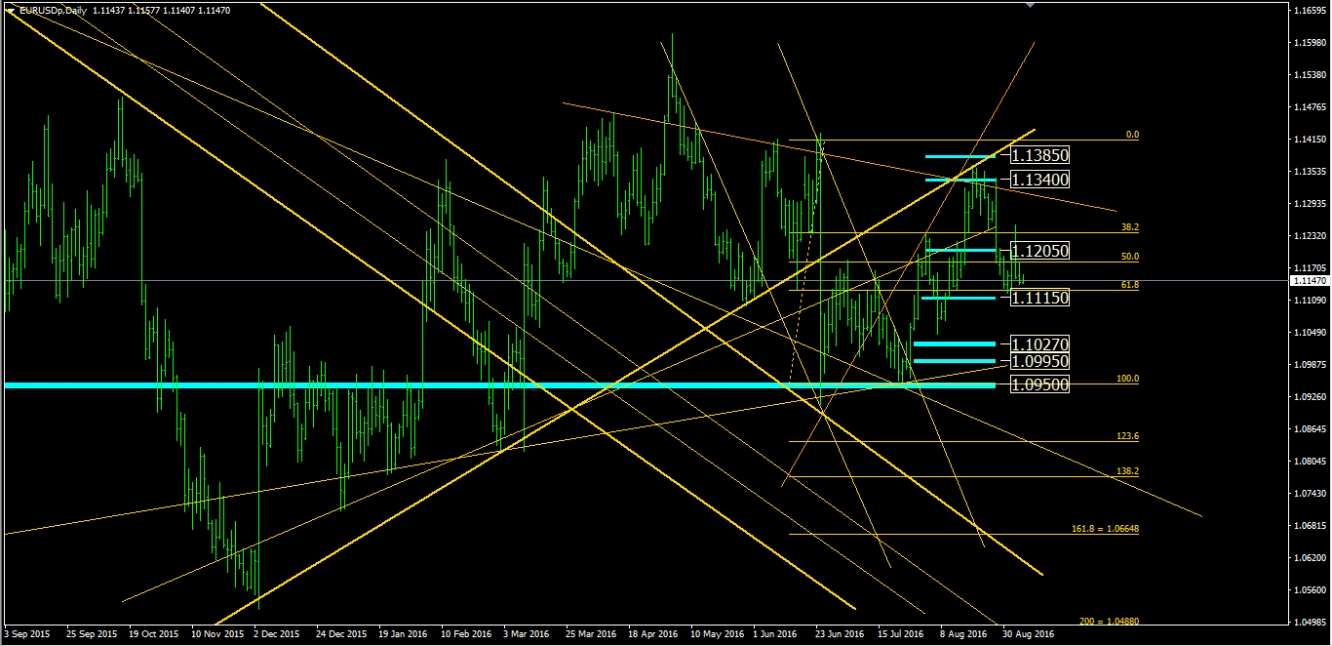
Weekly Trend: Neutral
1st Resistance: 1.1205
2nd Resistance: 1.1340
1st Support: 1.1115
2nd Support: 1.1027
EUR
Recent Facts:
22nd of July 2016, German Manufacturing PMI (key indicator of the activity level of purchasing managers in the manufacturing sector as surveyed in Germany)
Better than Expected. Setting a new high from May 2014
28th of July, German Unemployment Change
Better than Expected.
29th of July, European CPI (key preliminary inflation data in Europe)
Higher than Expected. Setting a new high since last February
18th of August, European CPI confirmed at 0.2% as Expected and as per previous month
23rd of August, German Manufacturing Purchasing Managers' Index (PMI) and Markit Composite PMI: they measure the activity level of purchasing managers in the manufacturing sector in Europe
Contrasted: Markit Eurozone PMI inched up to a seven-month high, while Manufacturing PMI and German Services PMI slow down in August
31st of August, European CPI (key preliminary inflation data in Europe)
Slightly lower than Expected
1st of September, Eurozone Manufacturing PMI
Slightly worse than Expected
USD
Recent Facts:
21st of July 2016, Existing Home Sales
Better than Expected. Setting a new high since August 2015, which was the highest value of the last 6 years
29th of July, Gross Domestic Product QoQ (preliminary)
Worse than Expected. Actual = +1.2% Expectations were at +2.6%
12th of August, U.S. Retail Sales (essential for a better understanding of the Fed’s future interest rates policies)
Worse than Expected
16th of August, Building Permits
Worse than Expected
17th of August, FOMC Meeting Minutes (U.S.A.)
Economists see the December meeting as the most likely time for a rate increase since it follows the U.S. presidential election
23rd of August, U.S. New Home Sales: it measures the annualized number of new single-family homes that were sold during the previous month
Better than Expected. Setting a new high since December 2007
25th of August, U.S. Core Durable Goods Orders MoM (measures the change in the total value of new orders for long lasting manufactured goods, excluding transportation items)
Better than Expected
26th of August, U.S. Yellen’s (Fed Chair) Speech
Fed’s Yellen says case for another interest-rate hike has strengthened but eyes on the next data from U.S.
31st of August, ADP Nonfarm Employment Change and Pending Home Sales
Both better than Expected
2nd of September, Nonfarm Payrolls
Worse than Expected
GBP/USD
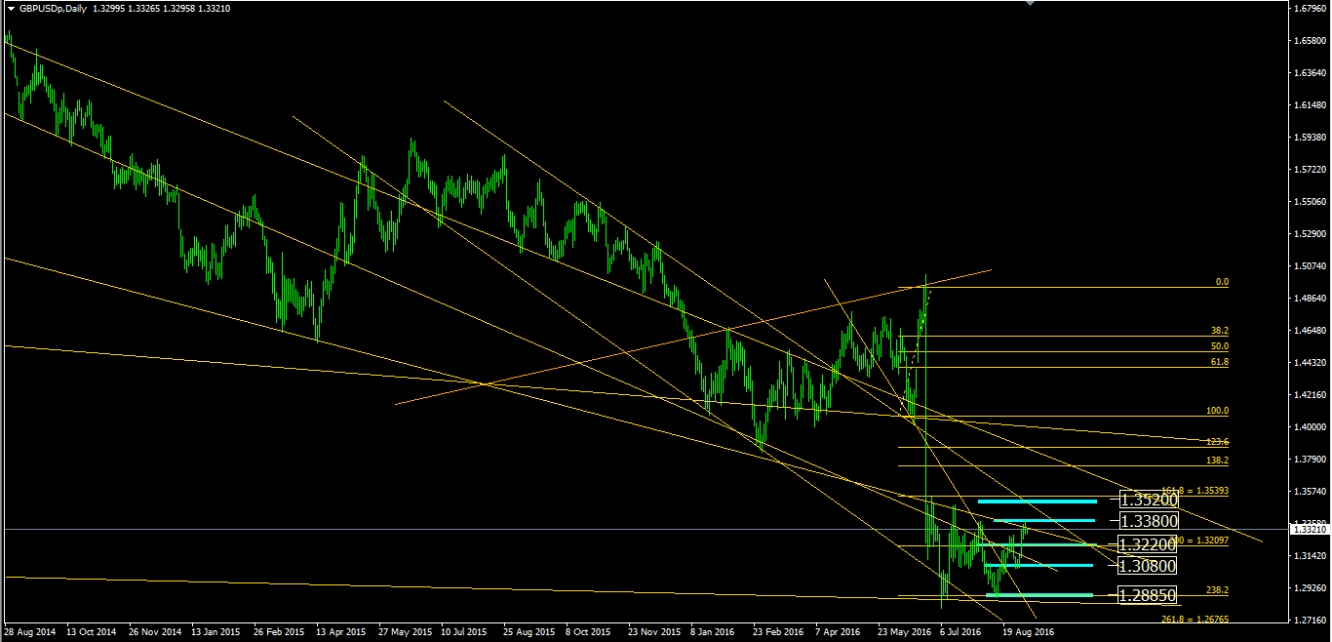
Weekly Trend: Neutral
1st Resistance: 1.3220
2nd Resistance: 1.3380
1st Support: 1.3080
2nd Support: 1.2885
3rd Support: 1.2680
GBP
Recent Facts:
22nd of July 2016, UK Services PMI (key indicator of the activity level of purchasing managers in the services sector)
Worse than Expected. Setting a new historical low, the lowest value of the last 7 years
27th of July 2016, Gross Domestic Product (preliminary)
Better than Expected
4th of August, Bank of England Interest Rates decision (expected a cut)
Bank of England lowers Interest Rates as Expected (record low of 0.25%) and increases purchase program
9th of August, Manufacturing Production (measures the change in the total inflation-adjusted value of output produced by manufacturers)
Slightly Worse than Expected
9th of August, Trade Balance
Worse than Expected. Setting a new historical low
16th of August, UK Consumer Price Index (measures the change in the price of goods and services from the perspective of the consumer. It is a key way to measure changes in purchasing trends and inflation)
Higher than Expected. Setting a new high since January 2015
18th of August, UK Retail Sales
Better than Expected. Core Retail Sales YoY at the highest since November 2015
1st of August, UK Manufacturing PMI (key indicator of the activity level of purchasing managers in the services sector)
Better than Expected. Setting a new historical high since December 2015
5th of September, UK Services PMI
Better than Expected
USD
Recent Facts:
See above.
AUD/USD
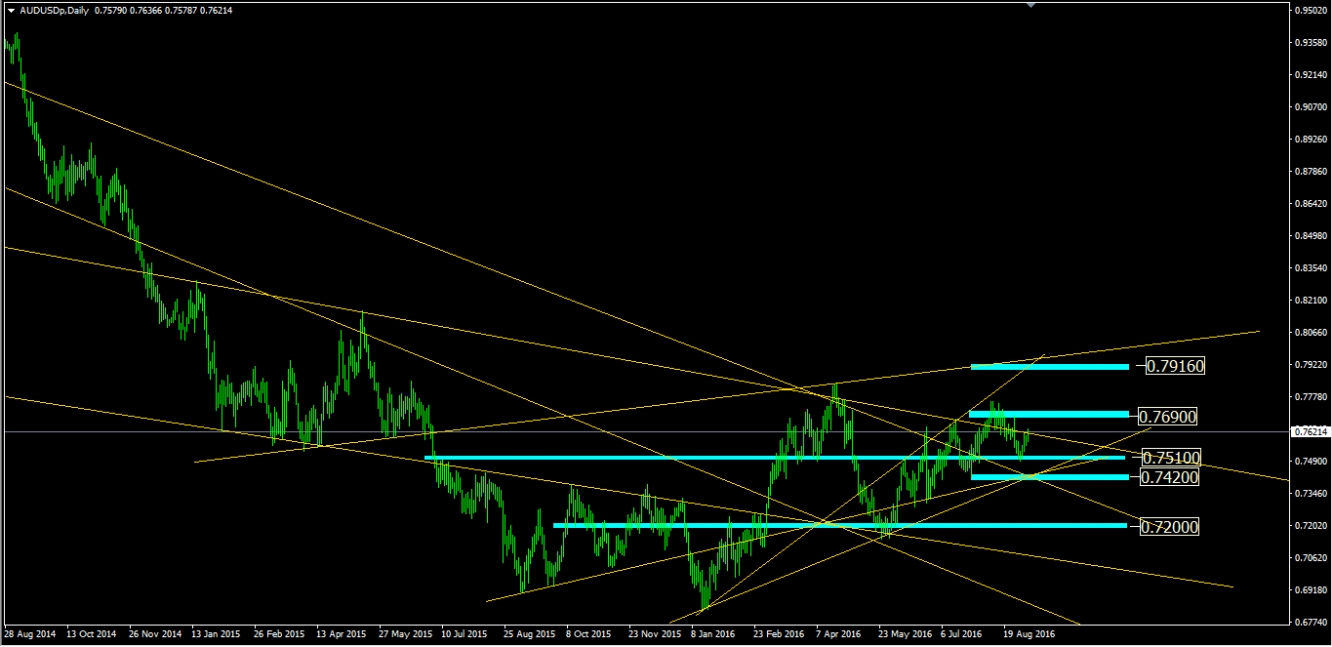
Weekly Trend: Bullish
1st Resistance: 0.7690
2nd Resistance: 0.7916
1st Support: 0.7510
2nd Support: 0.7420
3rd Support: 0.7200
AUD
Recent Facts:
19th of July 2016, Reserve Bank of Australia Meeting
Possible further easing in the next month to counteract the negative shock from the Brexit vote
26th of July, CPI (key inflation data in Australia) pared
2nd of August, Interest Rates decision cut to from 1.75% to 1.50% as Expected
4th of August, Retail Sales (Jun)
Worse than Expected
11th of August, Reserve Bank of New Zealand's rate statement
Interest rates cut (to 2%) as Expected
18th of August, Employment Change
Better than Expected. Highest since the beginning of this year
24th of August, New Zealand Trade Balance and Australia’s Construction Work Done (it measures the change in the total value of completed construction projects)
Worse than Expected
1st of September, Retail Sales and Private New Capital Expenditure
Worse than Expected
USD
Recent Facts:
See above.


