🔥 Premium AI-powered Stock Picks from InvestingPro Now up to 50% OffCLAIM SALE

Try A Spoonful Of Sugar: Technicals

Published 08/25/2017, 08:27 AM
SB
-

A spoonful of sugar helps the medicine go down…” Sugar has been going down, not the medicine. Since making a top in September last year sugar has pulled back for 12 months. This retraced 78.6% of the move higher that happened over the previous 12 months. Does sugar move in 12 month cycles? The sample size is small so it is difficult to make that leap. But the price action does set up for a reversal again now.

The chart below shows 3 key indicators to watch. The first is the Bollinger Bands®. They have flattened out on the bottom, giving support. A turn higher would be the first positive indicator. The RSI bottomed in May and June and is now trying to move back higher. A break to the upside through the mid line would be a second indicator.
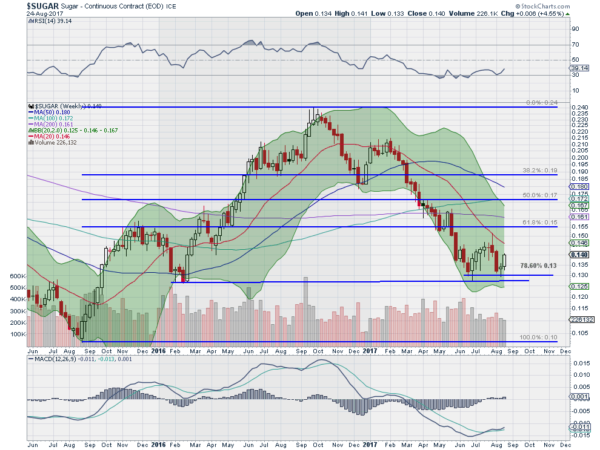
Weekly Sugar

The third is the MACD. It bottomed in June and is now crossing up. that in itself is a buy signal for many. All three moving in the right direction would be a big plus for sugar. But the most important indicator, price, needs to get over 14.7 to confirm a reversal out of a double bottom. That should also take it over the 20-week SMA, a marker that ended the last bull move when it crossed down in November 2016. Maybe it is time to try a spoonful of sugar again.

Latest comments

Loading next article…
Risk Disclosure: Trading in financial instruments and/or cryptocurrencies involves high risks including the risk of losing some, or all, of your investment amount, and may not be suitable for all investors. Prices of cryptocurrencies are extremely volatile and may be affected by external factors such as financial, regulatory or political events. Trading on margin increases the financial risks.
Before deciding to trade in financial instrument or cryptocurrencies you should be fully informed of the risks and costs associated with trading the financial markets, carefully consider your investment objectives, level of experience, and risk appetite, and seek professional advice where needed.
Fusion Media would like to remind you that the data contained in this website is not necessarily real-time nor accurate. The data and prices on the website are not necessarily provided by any market or exchange, but may be provided by market makers, and so prices may not be accurate and may differ from the actual price at any given market, meaning prices are indicative and not appropriate for trading purposes. Fusion Media and any provider of the data contained in this website will not accept liability for any loss or damage as a result of your trading, or your reliance on the information contained within this website.
It is prohibited to use, store, reproduce, display, modify, transmit or distribute the data contained in this website without the explicit prior written permission of Fusion Media and/or the data provider. All intellectual property rights are reserved by the providers and/or the exchange providing the data contained in this website.
Fusion Media may be compensated by the advertisers that appear on the website, based on your interaction with the advertisements or advertisers.
© 2007-2024 - Fusion Media Limited. All Rights Reserved.