
Quick Take
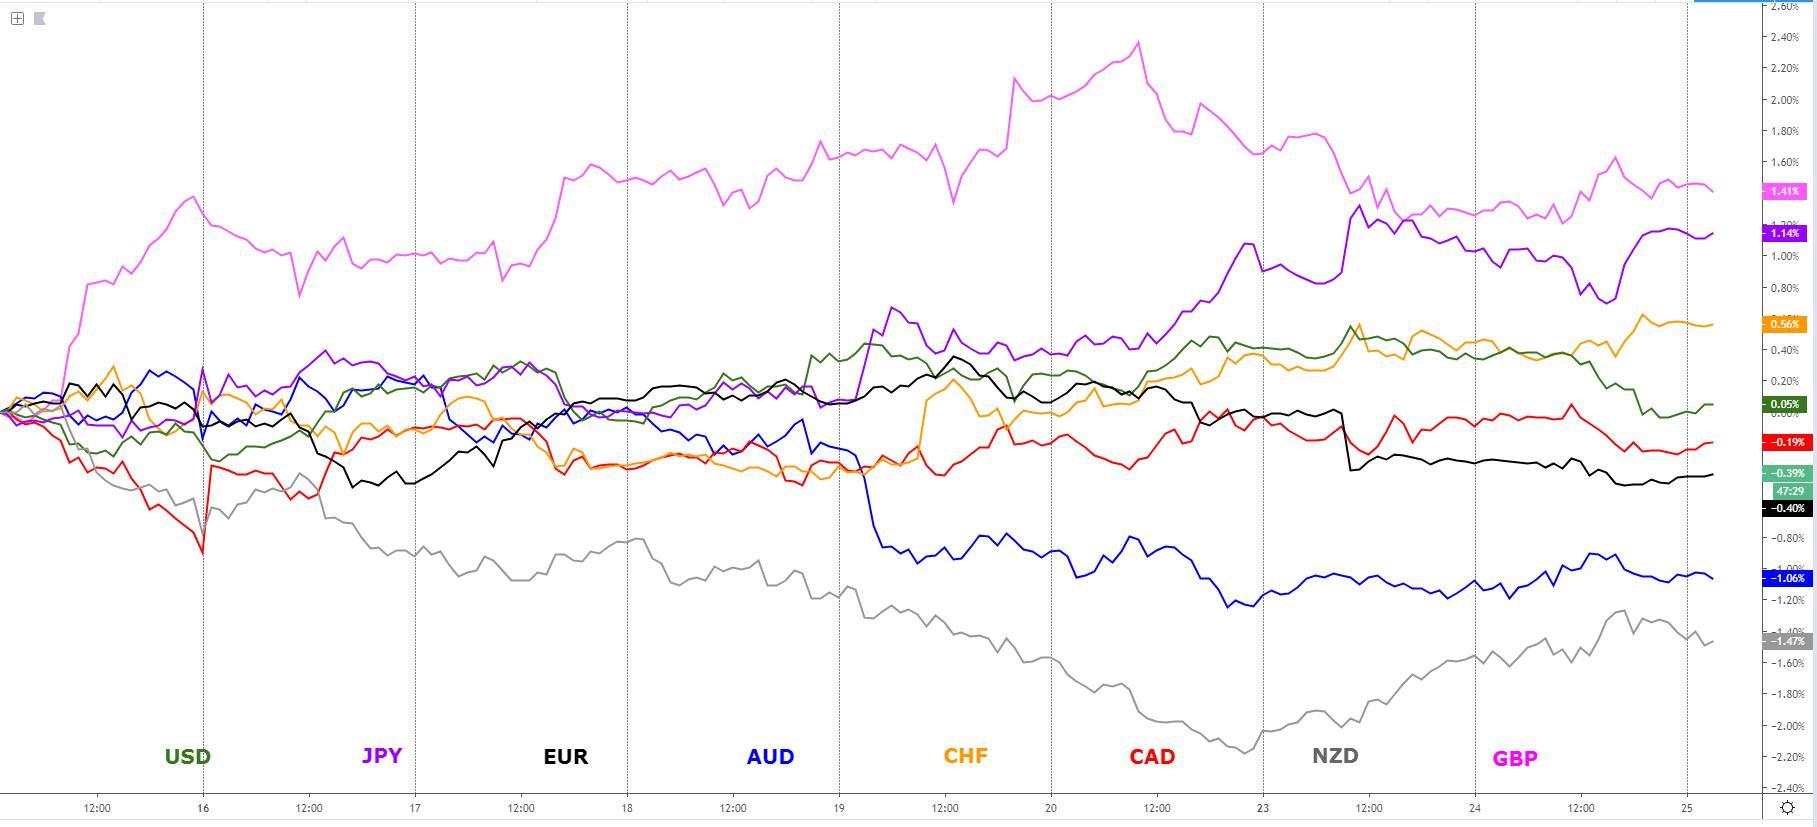
The trading dynamics in the currency market suffered a sudden change of heart as news broke out that Democrats have started proceedings for impeachment of Trump, which led to an extension of the USD weakness, which had kick-started earlier on the session as US economic data came of the soft side. Note, so as long as Republicans control Congress, there will be a very high bar indeed for any effort to impeach Trump to gain traction. The main beneficiaries of the convolution state of affairs in Washington when the proverbial hits the fan in equities and bonds gets bought up as protection vehicles included the usual suspects, that is, the yen and the Swissy. The beta currencies, especially the New Zealand dollar, also saw consistent demand ahead of the RBNZ policy meeting, as did the AUD, even if the appreciation was much more sudden after the market interpreted RBA Lowe speech on the Aussie economy on Tuesday as a strong hint that lower rates in the country may not come as early as expected. Lastly, the Canadian dollar and the euro were both on the bottom side of the performing board with the former dragged down by lower Oil while the latter suffering from bleak fundamentals in the euro area, even if it could have been worse on Tuesday, as the German IFO business climate index didn't come as bad as feared.
Narratives In Financial Markets
* The Information is gathered after scanning top publications including the FT, WSJ, Reuters, Bloomberg, ForexLive, Institutional Bank Research reports.
Trump impeachment spooks markets: The proceedings for a formal impeachment inquiry on President Trump by Democrats is officially underway after a press conference by House Speaker Pelosi, which led to a major setback in risk trades as equities and bonds yields experienced sharp falls while the price of gold jumped, in part driven by broad-based USD weakness. The controversy around allegations that President Trump tried to exert pressure on Ukraine's government to investigate Joe Biden and his son has been the catalyst. The President has vowed he will make public an unedited transcript of his talk with the Ukrainian President.
Trump throws a curve ball to China: The speech by Trump in the UN threw further fueled into the sell-off in risk trades as he takes a very critical stance towards China, Iran and social media enterprises. On China, the president said that “not only has China declined to adopt promised reforms, but it has embraced an economic model dependent on massive market barriers, heavy state subsidies, currency manipulation, product dumping, forced technology transfers, and the theft of intellectual property and trade secrets on a grand scale.” While Trump’s speech implied he still hopes for a deal to be done, he added “as I have made very clear, I will not accept a bad deal for the American people”. You’d think this was a good opportunity for Trump to tone things down a tad after China gave waivers to local state and private companies to purchase US soybeans tariff-free, but it didn’t seem to matter for Trump.
UK PM suffers major setback: The sterling found buying interest after the ruling of the UK Supreme Court unanimously determined as unlawful UK PM Johnson’s suspension of parliament, effectively giving the green light for the Speaker of the House to reconvene Parliament tomorrow. Opposition parties are calling for Johnson to resign, with a potential confidence vote to remove Johnson from office a real possibility. It remains to be seen whether or not pro-EU Tories will support the notion, which is a key determiner to see the motion succeed. The risk that the government collapses, which may lead to a unity government taking over, makes the prospects of an extension of Article 50 more likely. Also, the resumption of Parliamentary session gives more chances for MPs to block a no-deal Brexit.
RBA Lowe speech lowers chances of Oct cut: The Aussie found solid demand before retracing as risk-off ensued, following an upbeat speech by RBA Governor Lowe. The much-awaited speech on the Australian economy didn’t disappoint for those volatility seekers, resulting in a significant jump in the AUD as the remarks were interpreted as not carrying the urgency to cut rates further in October just yet. This was manifested in pricing out a 25bp rate cut from 82% to 60%. Lowe said that “after having been through a soft patch, a gentle turning point has been reached” and he added “the fundamental factors underpinning the longer-term outlook for the Australian economy remain strong.” Lowe also added some ambiguity to his speech by noting that “further monetary easing may well be required.”
Poor US economic data: The US September Conference Board consumer confidence underwhelmed at 125.1 vs 133.0 expected, coming off a prior print of 135.1, which was the highest since 2000. The sharp drop, including the lowest level in expectations since January was a red flag. The poor result follows a similar disappointment in the University of Michigan consumer confidence survey. Meanwhile, the Richmond Fed Manufacturing Index for September -9 vs. 1 estimate. The soft data in the US kickstarted the weakness seen in the US dollar this Tuesday.
Germany’s IFO not as bad as feared: The business climate index didn’t come that bad even if the expectations remain at the lowest in a decade. Besides, unlike the German PMI, where evidence started to emerge about the recession in the manufacturing survey spilling over into the services sector, this time the IFO failed to show proof of that.
RBNZ policy decision up next: The next key focus in Asia will be the RBNZ policy decision, with the Central Bank expected to keep its powder dry by not touching its rate settings this time. The pricing for a 25bp rate cut today stands at just over 10%, with calls for further easing around November standing at a 90% conviction, which is the current pricing for a cut even if that scenario will vary today based on the update in the NZ economy by the RBNZ.
Recent Economic Indicators & Events Ahead
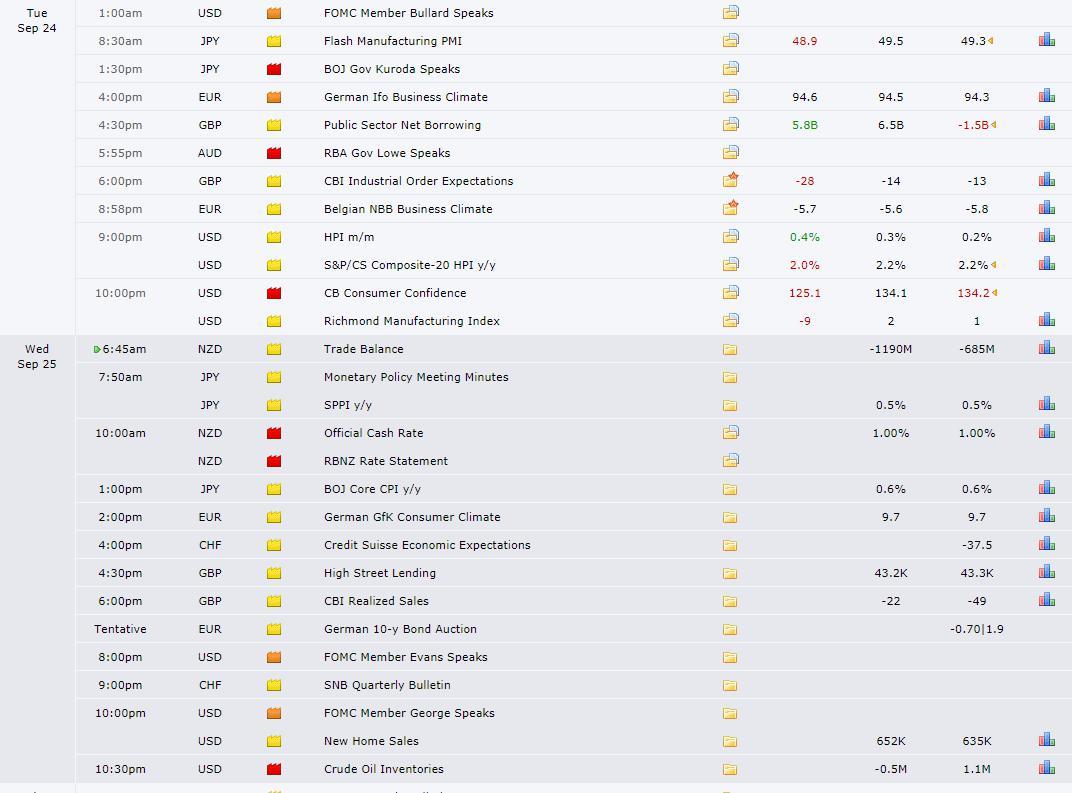
Source: Forexfactory
A Dive Into The Charts
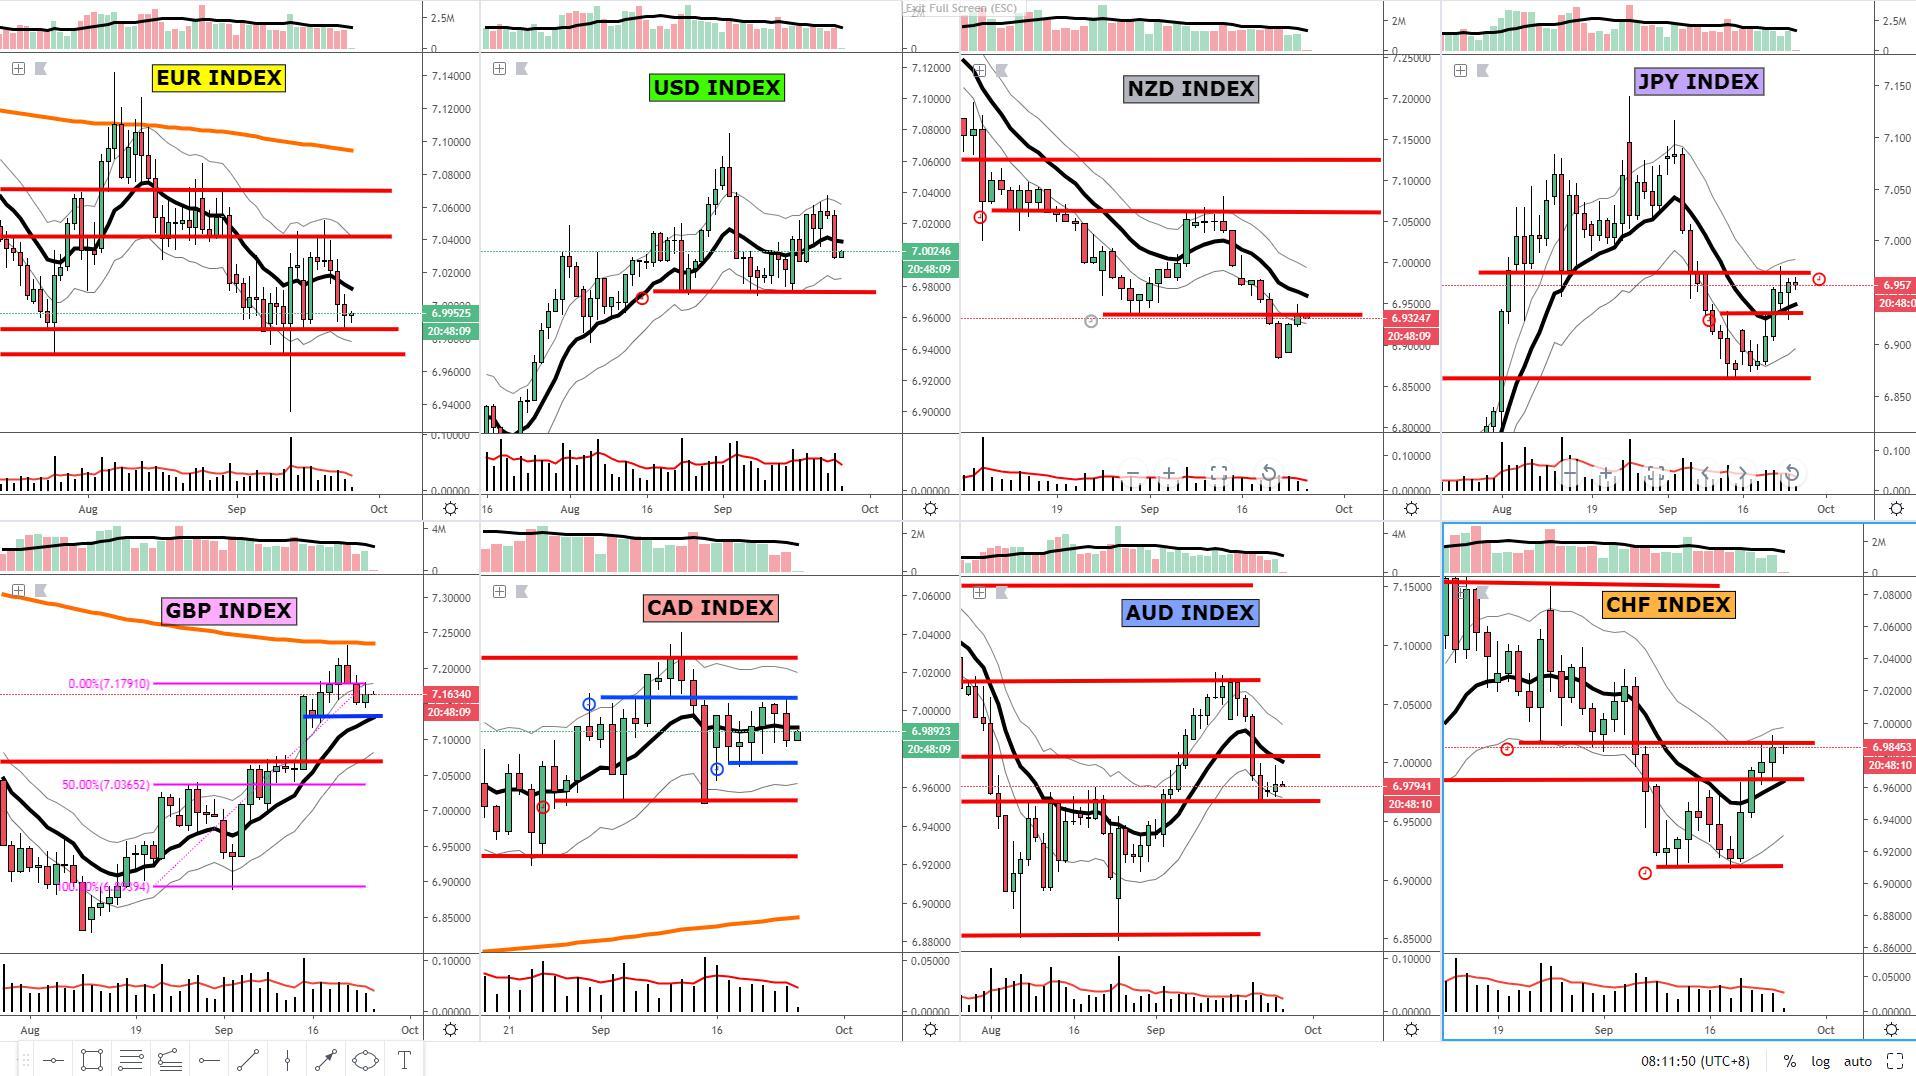
The EUR index has transitioned very rapidly from its daily resistance area into a demand vicinity where chances are that a buy-side campaign may be re-initiated judging by the number of times the level has proven to act as an accurate location to bid up the single currency. Since the last test of the level on Sept 16 led to a successful price rotation, it provides further credence that buyers may show up to move the price away towards a retest of the daily baseline, which gives about 0.2-0.25% of room available. Should the level of support be violated, it will then lead to the index falling an additional 0.2% until the next level of daily support, as depicted by the lowest red line, is tested.
The GBP index saw a spike that came to an abrupt stop at the 100% proj level (in magenta line), now acting as clear resistance, and proof of that is the number of times is acting as a reactionary level. As long as the sell-side pressure keeps emerging out of the 100% proj level, the risk of further setbacks into the daily baseline is a real possibility. If that test of the baseline were to eventuate, the area offers a great confluence for bids to return as the baseline converges with a level of support, most visible in the 8h chart, hence why it’s drawn in blue to make that distinction. The playbook in the GBP remains uncertain and totally dominated by Brexit as usual.
The USD index outlook is much more uncertain after a commanding red candle on the daily managed to penetrate the baseline with an increase in aggregate tick volume. Note, the over extension of Tuesday’s movement may create potential opportunities to buy the US dollar currency at fairly attractive levels for a retest of the daily baseline. That said, there are no technical grounds to be too optimistic on long swing trades in the USD as the daily candle close at the very low means the buying pressure has temporarily evaporated.
The CAD index continues to be sandwiched between support and resistance, effectively allowing the currency for gyrations worth over 0.5% before failing to auction beyond these parameters. The critical and most immediate levels to watch out for have been drawn in blue, as these are best observed through the 8h chart as opposed to the daily. Whenever a chart enters conditions of choppiness as is the case here, the baseline should be shrugged off and keep the focus on engaging in buy or sell side opportunities at the edges of the range to maximize risk reward.
The NZD index has come to the anticipated level of resistance, from where anything can occur, which will be totally dependent on the outcome of the RBNZ policy meeting. If the RBNZ sounds less dovish, the baseline on the daily is the next level to target, while a more dovish interpretation would see the underlying bearish trend to resume for a potential retest of the low.
The AUD index keeps finding demand imbalances, with the price moving further away from a critical level of daily support, outlined in a red line. The current inertia is for the currency to keep recovering further ground for a potential test of the baseline, an area confluent with a daily level of horizontal resistance as per the swing low back in mid June. Any setback in the price of the Aussie is set to find further pockets of demand as the line of daily support gets retested.
The JPY index is currently compressed between a level of resistance (in red) overhead and a level of support, from where the price bounced from on Tuesday. Looking for trades away from these areas offers attractive propositions and the most technical clarity to initiate buy-sell trades. Even if one can observe that the index has recovered the baseline with an increase in aggregate tick volume, it’s problematic to enter trades straight into a level of resistance, as it allows very little room for the price to maneuver before the anticipated sell pressure arises.
The CHF index should continue to struggle at these high levels as a level of key daily resistance has now taken over the proceedings, from where supply imbalances may ensue. To the downside, assuming that sellers do take temporary control off the resistance level, there is room for about 0.25% of depreciation in the index before buying activity returns with more conviction, as that’s where a powerful combination of the daily baseline + horizontal level meet.
Important Footnotes
- Risk model: The fact that financial markets have become so intertwined and dynamic makes it essential to stay constantly in tune with market conditions and adapt to new environments. This prop model will assist you to gauge the context that you are trading so that you can significantly reduce the downside risks.
- Cycles: Markets evolve in cycles followed by a period of distribution and/or accumulation. To understand the principles applied in the assessment of cycles, refer to the tutorial
- POC: It refers to the point of control. It represents the areas of most interest by trading volume and should act as walls of bids/offers that may result in price reversals. The volume profile analysis tracks trading activity over a specified time period at specified price levels. The study reveals the constant evolution of the market auction process.
- Tick Volume: Price updates activity provides great insights into the actual buy or sell-side commitment to be engaged into a specific directional movement. Studies validate that price updates (tick volume) are highly correlated to actual traded volume, with the correlation being very high, when looking at hourly data.
- Horizontal Support/Resistance: Unlike levels of dynamic support or resistance or more subjective measurements such as fibonacci retracements, pivot points, trendlines, or other forms of reactive areas, the horizontal lines of support and resistance are universal concepts used by the majority of market participants. It, therefore, makes the areas the most widely followed and relevant to monitor.
- Trendlines: Besides the horizontal lines, trendlines are helpful as a visual representation of the trend. The trendlines are drawn respecting a series of rules that determine the validation of a new cycle being created. Therefore, these trendline drawn in the chart hinge to a certain interpretation of market structures.
- Correlations: Each forex pair has a series of highly correlated assets to assess valuations. This type of study is called inter-market analysis and it involves scoping out anomalies in the ever-evolving global interconnectivity between equities, bonds, currencies, and commodities.
- Fundamentals: It’s important to highlight that the daily market outlook provided in this report is subject to the impact of the fundamental news. Any unexpected news may cause the price to behave erratically in the short term.
- Projection Targets: The usefulness of the 100% projection resides in the symmetry and harmonic relationships of market cycles. By drawing a 100% projection, you can anticipate the area in the chart where some type of pause and potential reversals in price is likely to occur, due to 1. The side in control of the cycle takes profits 2. Counter-trend positions are added by contrarian players 3.