
China, via the Commerce Ministry, confirmed earlier reports that it only aims to reach a partial trade deal as part of the trade talks this week (Thursday, Friday), without including in the negotiations reforms on industrial policies or government subsidies. he behavior by the Yen tells us there is clearly some build up of expectations that yet another vague temporary ceasefire can be agreed upon...
Quick Take
Even if traders should re-calibrate any over-optimistic expectations of a big trade deal between the US and China this week, the market has so far treated the news that China is only willing to mid halfway from all US demands as yet again, another glass half full type of event.
To draw some parallels, just as the market treated the law that forces a no-deal Brexit to be delayed as a positive development for the GBP, the same way seems to be interpreted if the US and China can agree to another truce that would avoid the next increase in tariffs scheduled for October 15, as it would remove an immediate risk out of the way, even if the underlying issue will remain.
The behavior by the Yen tells us there is clearly some build up of expectations that yet another vague temporary ceasefire can be agreed upon, although by connecting the dots, one should be in high alert, as Trump has reiterated in multiple occasions that either the US pulls off a big deal with China or he'd rather have no deal at all.
It implies partial complacency by Mr. Market. I mention partial because the Aussie and Kiwi were in the losing group of currencies on Monday, which you wouldn't expect if a truce is being priced in.
Bottom line, I think the movements in the Oceanic currencies are a better reflection of the dicey environment. The US Dollar, the Canadian dollar, the Swiss franc and the Euro were all, in a larger or lesser extent, the beneficiaries of Monday's flows, while the British pound is once again under tepid pressure as UK PM Johnson gets a devastating rejection of its Irish plan.
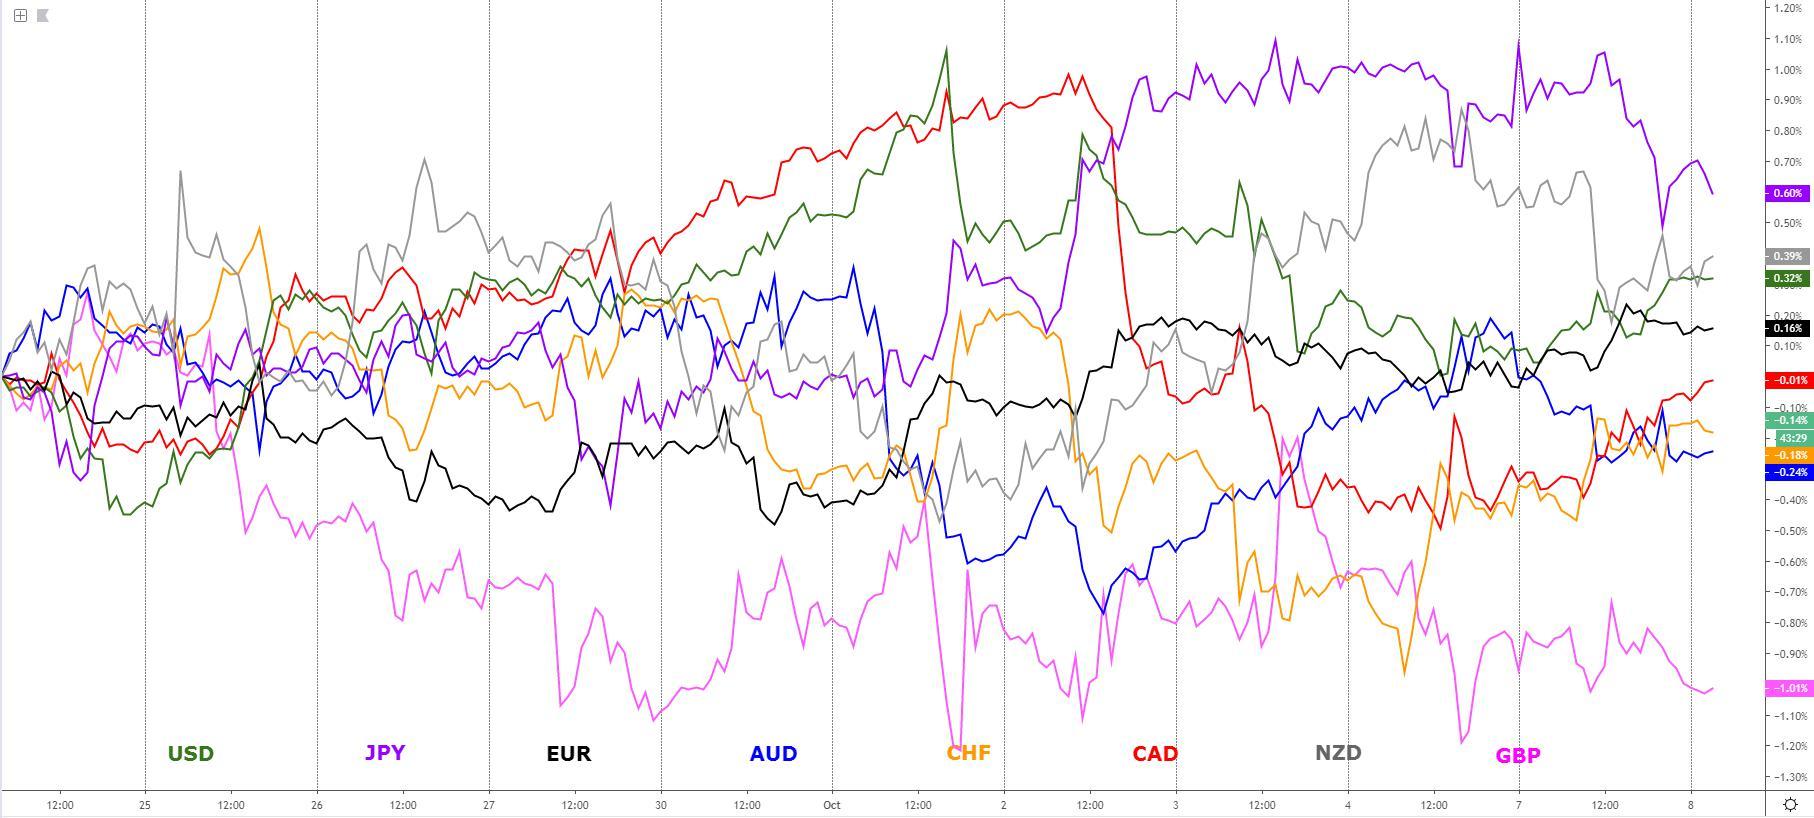
The indices show the performance of a particular currency vs G8 FX. An educational video on how to interpret these indices can be found in the Global Prime's Research section.
Narratives In Financial Markets
* The Information is gathered after scanning top publications including the FT, WSJ, Reuters, Bloomberg, ForexLive, Institutional Bank Research reports.
China aims for only a partial deal: China, via the Commerce Ministry, confirmed earlier reports that it only aims to reach a partial trade deal as part of the trade talks this week (Thursday, Friday), without including in the negotiations reforms on industrial policies or government subsidies.
Sticking points won't be negotiated: According to Fox News, China is prepared to set out a timetable for the harder issues to be worked out next year. Fox Business' Edward Lawrence, citing China's commerce ministry, wrote: “The Chinese Commerce Ministry says what is not in the table and never will be is changes to their laws to protect intellectual property. The Commerce Ministry telling us that the Chinese will deal with intellectual property theft through administrative regulations.”
China takes advantage of Trump's debilitated position: The fact that Trump is in need to score a big political win amid the scandal of corruption in his Ukraine call from last month, which was partly intended to influence in the meddling of Democrat candidate Joe Biden’s affairs has given China leverage. Whether or not the US blinks by being more flexible in agreeing to a mini deal remains to be seen. Note, Trump has reiterated that either they make a comprehensive full deal or no deal.
Key topics of trade discussion shared by the WH: The White House has published a memo outlining the topics of discussions that will take place as part of this week’s US-China trade talks, scheduled for at least two days. The statement notes the following six topics of discussion: Forced technology transfer, Intellectual property rights, Services, Non-tariff barriers, Agriculture, Enforcement.
Time to re-calibrate over-optimistic expectations: The best one can hope for in this week’s US-China trade talks may be yet another truce in which Trump may agree to extend the deadline for the next increase in tariffs scheduled for October 15, when $250bn worth of Chinese imports will be assigned 30% tariffs from 25%.
UK PM's Irish backstop proposal rejected by the EU: The UK Guardian, in a leaked document, it has learnt the European Union’s full devastating point-by-point rejection of Boris Johnson’s Brexit proposals for the Irish border. As the paper reports, “the disclosure follows the prime minister’s claim on Monday that he had not yet heard the EU’s thoughts on the legal text tabled by Downing Street…”
Trump ramps up rhetoric against Turkey: Trump warns he will obliterate Turkey in a controversial tweet, which has led to selling pressure in the Turkish lira, as he considering a withdrawal of the American forces from Syria, immediately condemned among congressional Republicans and protested by America’s allies.
Trump said it was “time for us to get out” and let others “figure the situation out.” Trump added that “if Turkey does anything that I, in my great and unmatched wisdom, consider to be off limits, I will totally destroy and obliterate the Economy of Turkey (I've done before!). They must, with Europe and others, watch over...the captured ISIS fighters and families…”
Recent Economic Indicators & Events Ahead
Out of all the events scheduled for today, pay special attention to Fed Chair Powell, due to speak at 5.30am AEDT, at the US National Association of Business Economists, in a speech titled “A view from the Federal Reserve Board of Governors” which will include Q&A. The market will be interested to grab new clues on Powell’s evaluation of the economy after last week’s ISM misses, both the manuf and non-manuf PMIs, alongside a rather mixed payrolls report on Friday. Currently, the market is pricing a Fed rate cut in October at 73% at the close of NY on Monday.
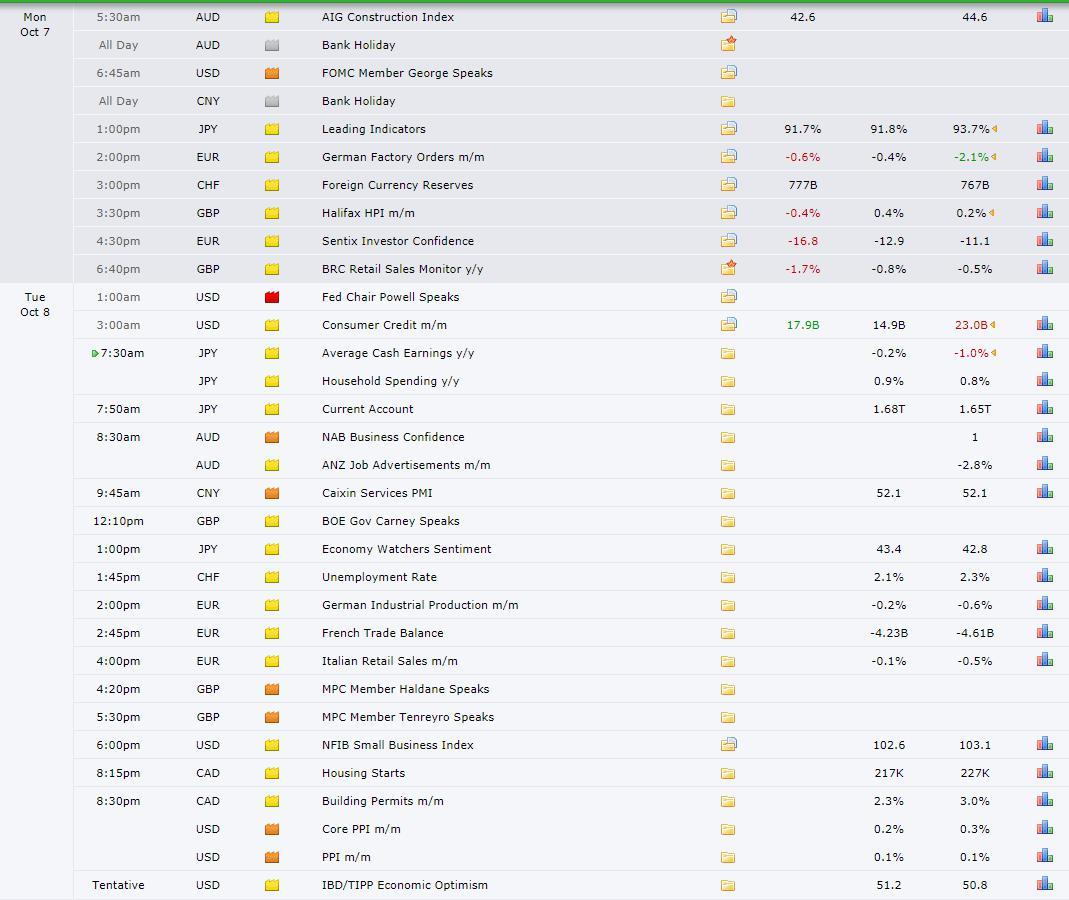
Source: Forexfactory
A Dive Into The FX Indices Charts
The indices show the performance of a particular currency vs G8 FX. An educational video on how to interpret these indices can be found in the Global Prime's Research section.
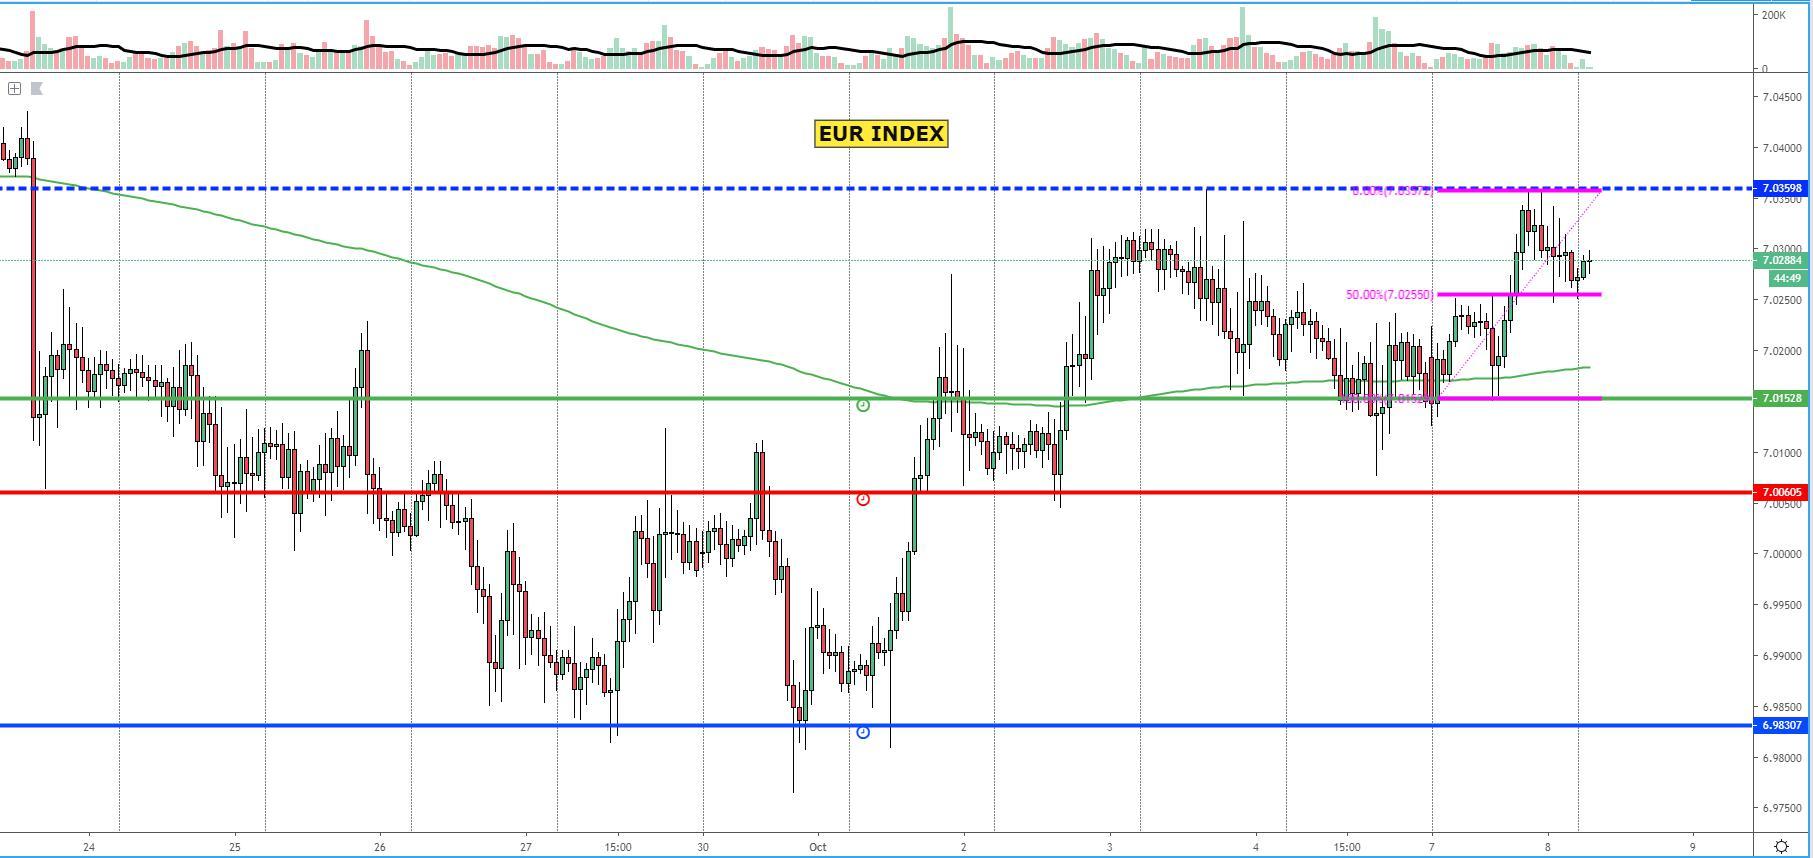
The EUR index has created a higher high in the hourly chart after heavy buy-side pressure came through the early European session, leading to a retest of the prior swing high. encountered resistance, which marked Monday’s high, was a challenging level to break as it perfectly aligned with a 100% proj target, hence why offers eventually managed to pull the price away. There are three well-defined areas to expect the clearest imbalances of demand/supply in the Euro this Tuesday, al compressed within a narrow 0.3% range. The delimitation of the current range include the latest resistance found, a new hourly support after it achieved a successful rotation, with the midpoint of the range, represented via the 50% fib retrac, another proven reactionary level where residual demand is seen in the Euro.
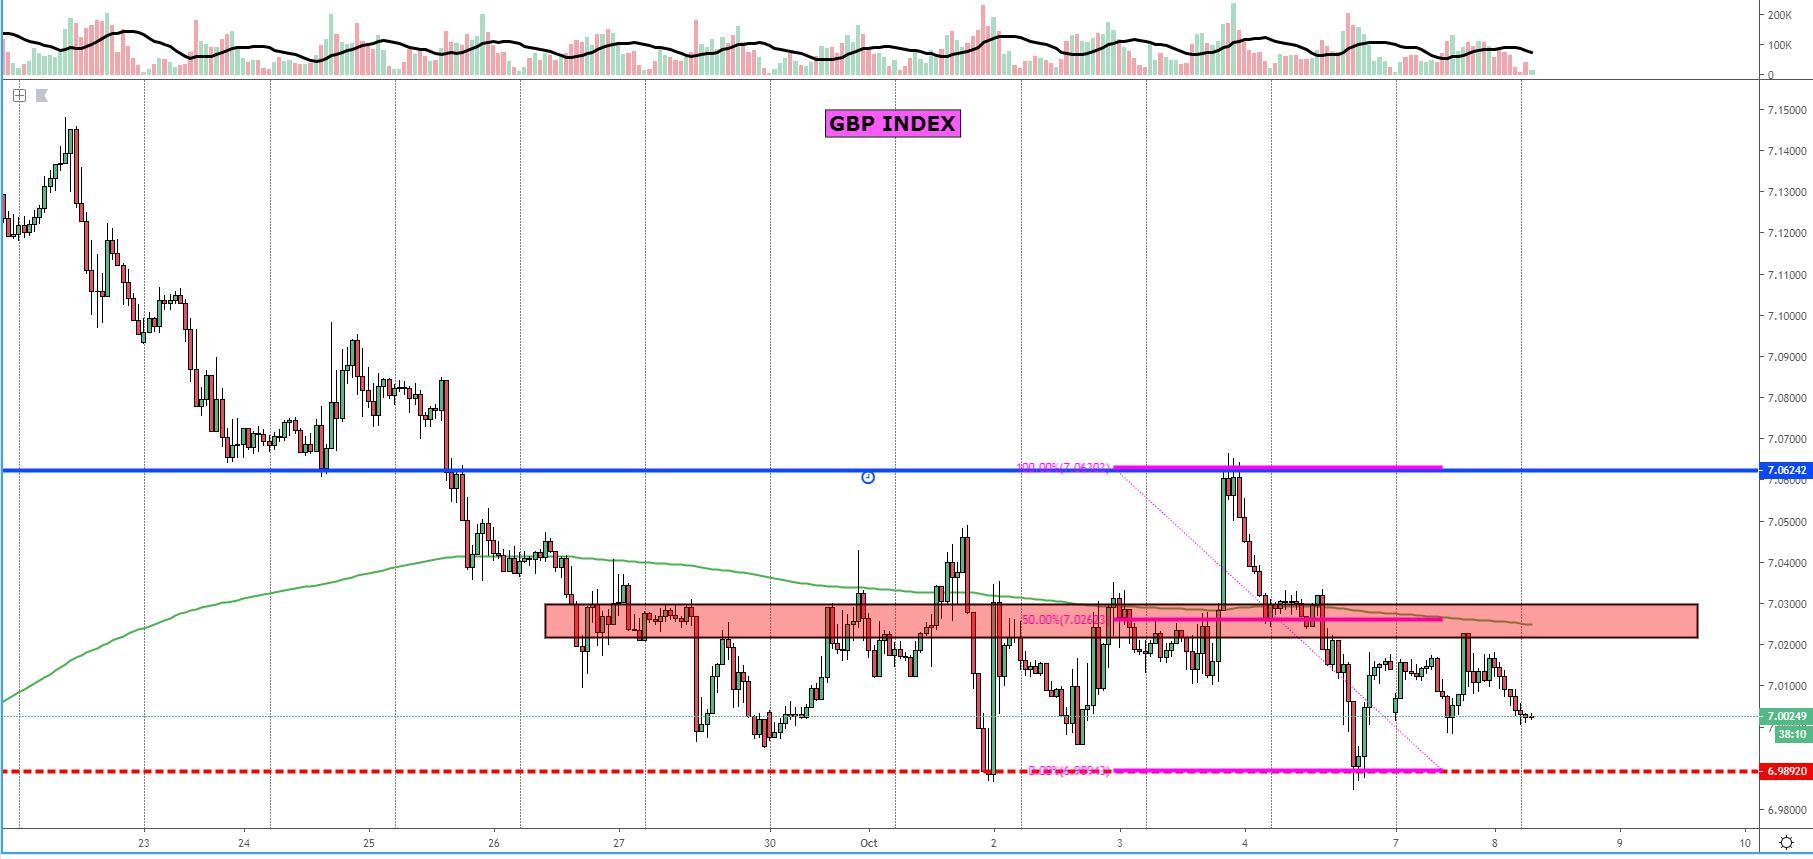
The GBP index has gone through a rather uneventful technical day, with the undefined outlook extending into Tuesday as part of a broader range context with over 1% of room for the price action to fluctuate before encountering macro bids and offers. The levels that continues to offer the best risk reward remains a tested level of daily support near-by, while the topside sees the mid point of the range as the area where sellers have set its new stronghold, as depicted by the amount of time the price action has been finding equilibrium below this mid point as opposed to the ephemeral time that GBP buyers managed to stay above the red rectangle midpoint. Overall, sellers appear to be gaining ground and conviction in the context of a huge demand imbalance on the daily that keeps being tested, with each test a greater chance of eventually breaking.
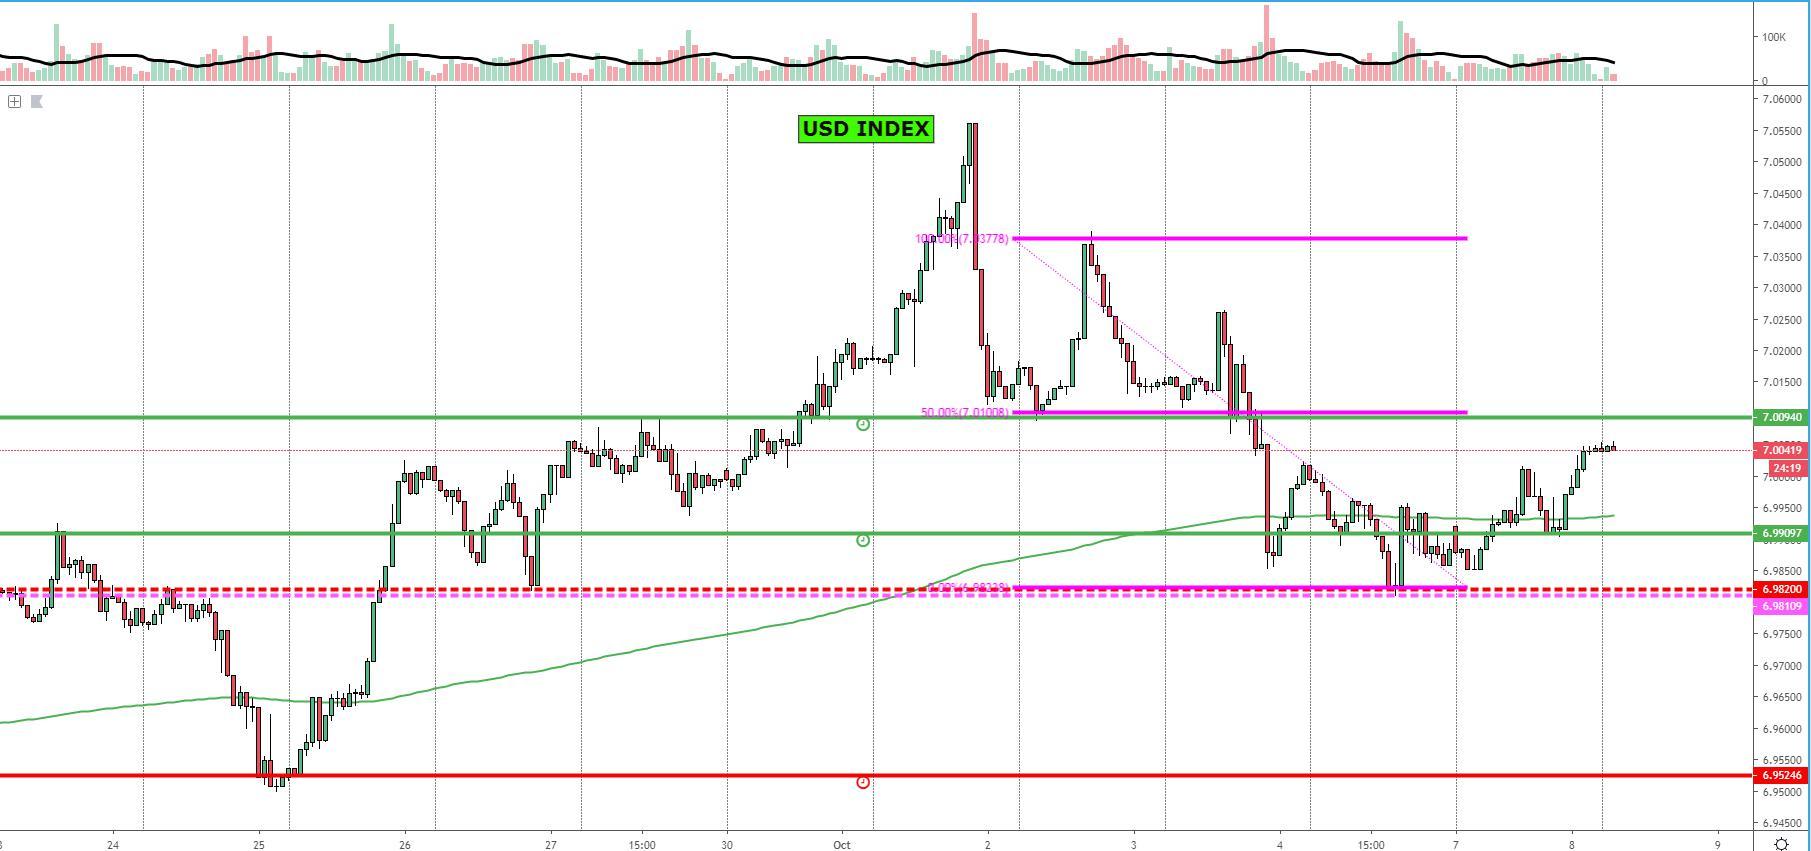
The USD index has so far respected an area of daily demand imbalance from where a new buy-side campaign has been initiated, paying dividends for intraday buyers as manifested by the first successful hourly rotation breaking into a short-term buy-side structure. Notice, in line with the principles of market structure I regularly outline, the reversal of the selling bias came at the 100% proj target. Fast forward, the real test for the USD traders’ interest will come on a test of overhead resistance, which is expected to see an imbalance of supply on a first touch, as it represents the 50% fibonacci retracement from last week’s decline. The context under which the USD trades, above the baseline, makes the short bias a risky one to support, especially on the basis that the level is only visibly identifiable through the hourly chart as the color indicates.
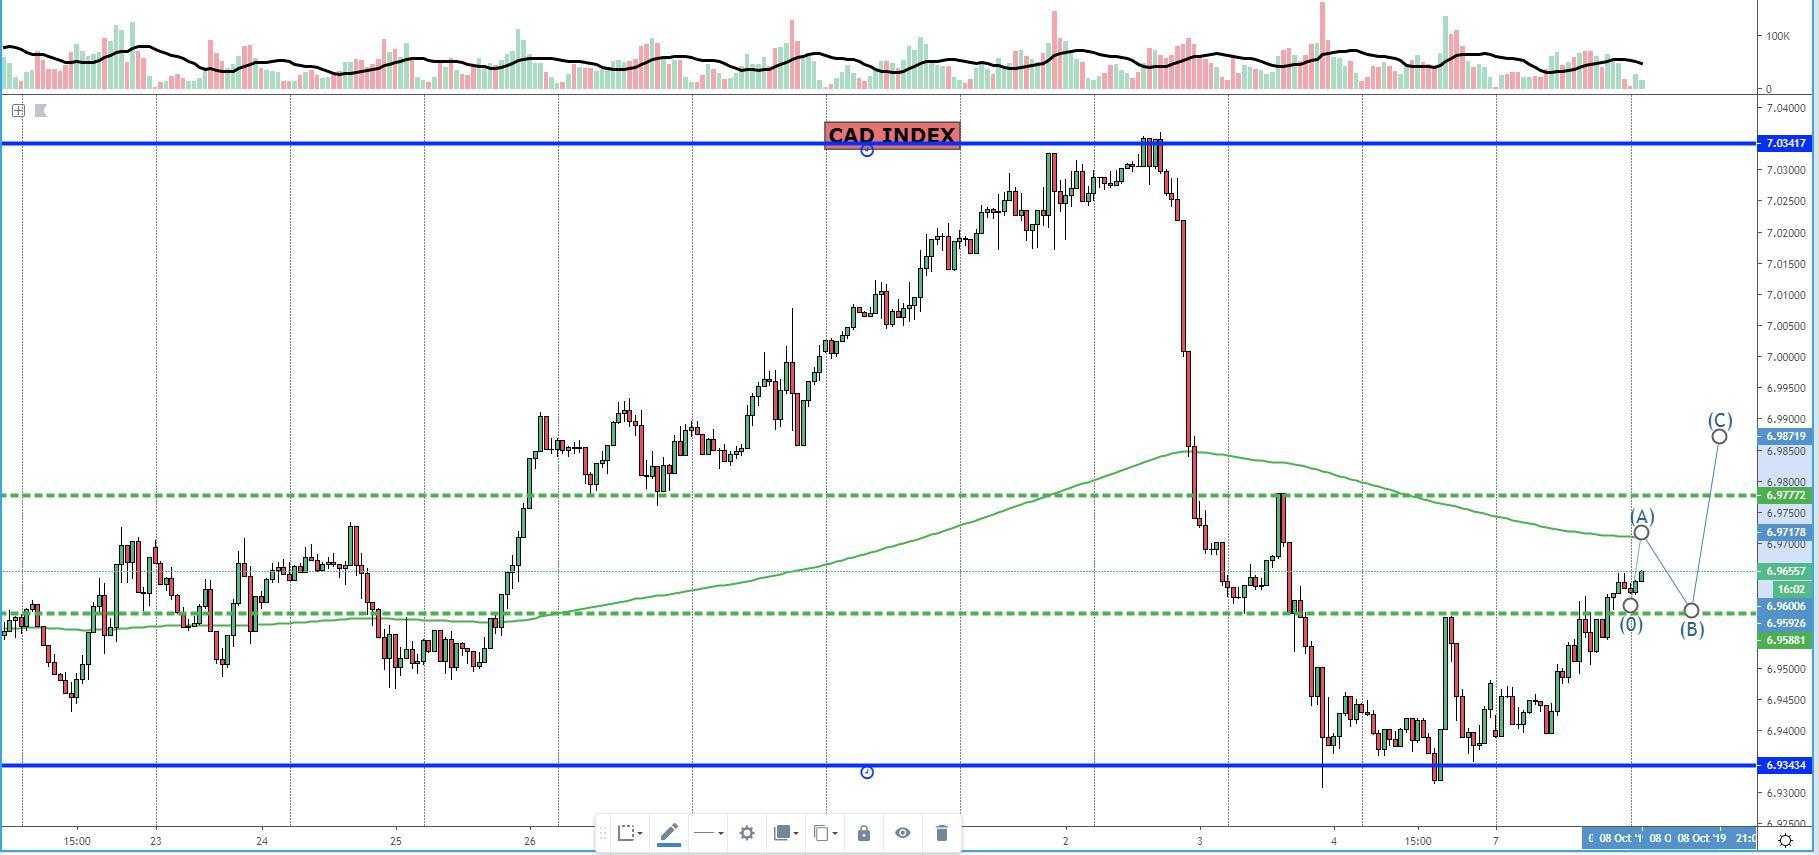
The CAD index has breached its previous swing high, allowing the structure to now shift to a buy-side bias in the hourly chart as higher highs get printed on the back of a double bottom. The pricing of the CAD remains below the 13-day ema but there is room to witness further upside appreciation until the next supply imbalance detected in the hourly chart (about 0.2%). Any setback in the valuation of the CAD should seen, given the successful rotation, strong demand re-emerging off the recent lows, which is why I’ve highlighted the area as a new-found level of demand imbalance to be expected off the 8h chart, which adds weight. If we see a larger upside extension before a retest of the breakout point, this may act as a significant level of support of the hourly on a backside retest. We could anticipate to see the price test the 13-d ema, be rejected, find further buyers on that backside retest, and then resume the uptrend.
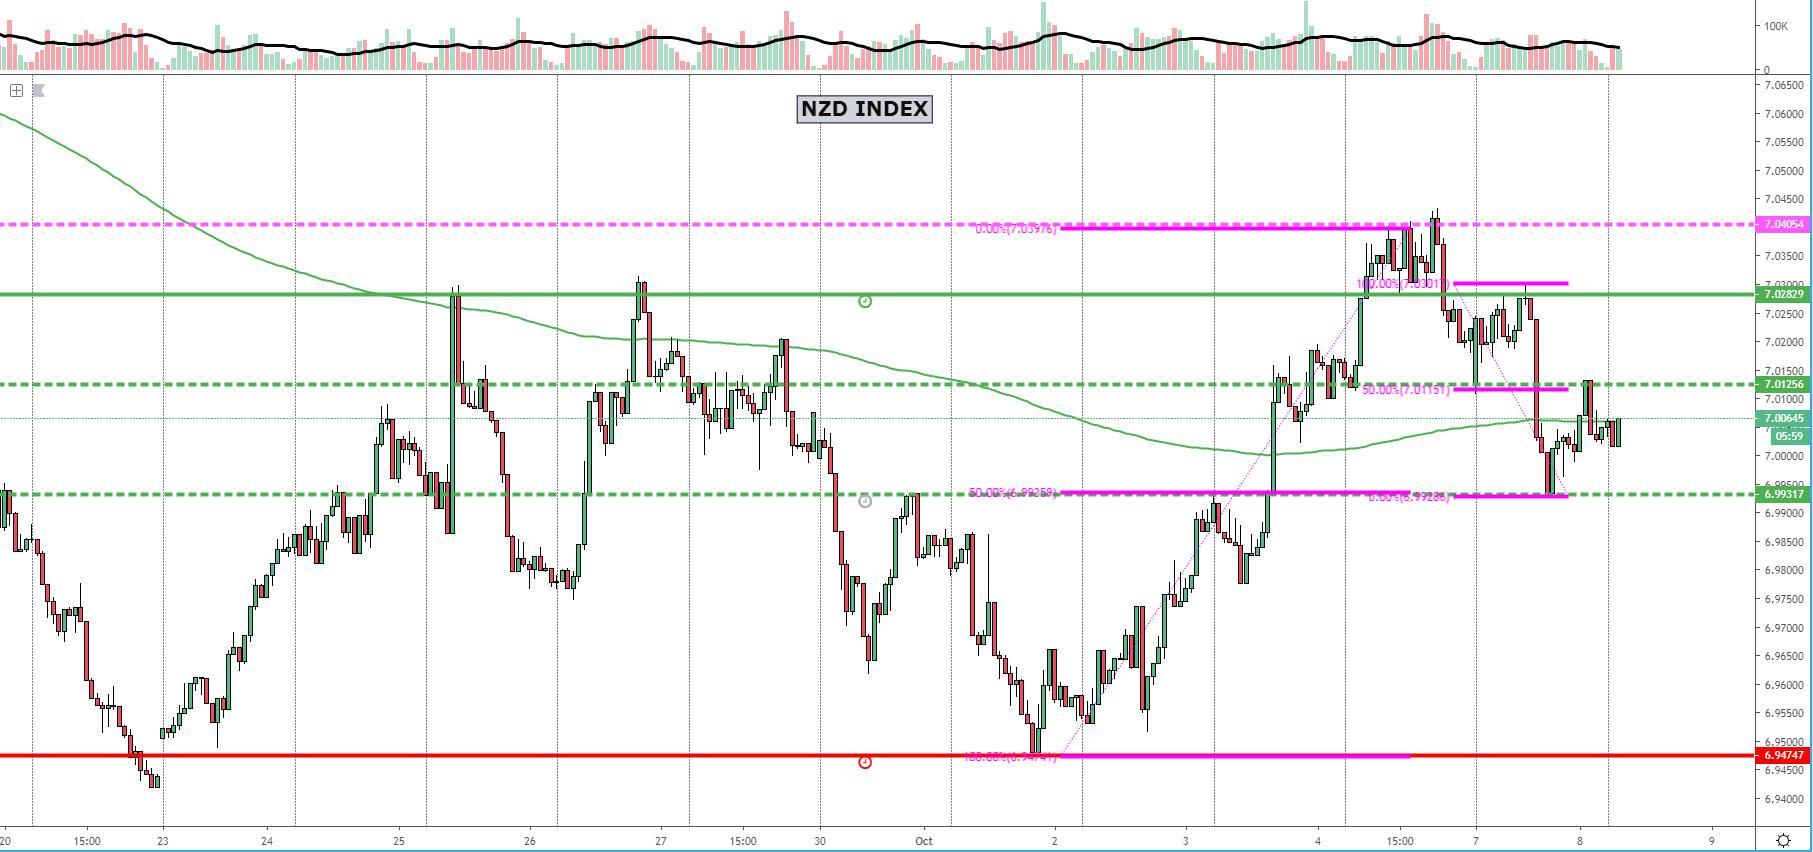
The NZD index is trapped between hourly levels of support and resistance, both tested and rejected on the first pass, which make the areas no longer as relevant to use as reactionary levels since it won’t be a fresh test. Patience for fresh new levels to be generated is required, unless the NZD can recover all the way up to test an untested area of supply imbalance on the hourly, which would still hold sufficient credence to expect a reaction off it. The drawing of the fibonacci retracement (0,50,100) helps us to really step out and identify the 3 key levels in this market as the current structure stands. What we’ve seen in the last 24h is the NZD buyers stepping in at the 50% retracement of its larger range (micro 100% proj target), only to see sellers popping up at the retest of the breakout point post a successful rotation in the hourly.
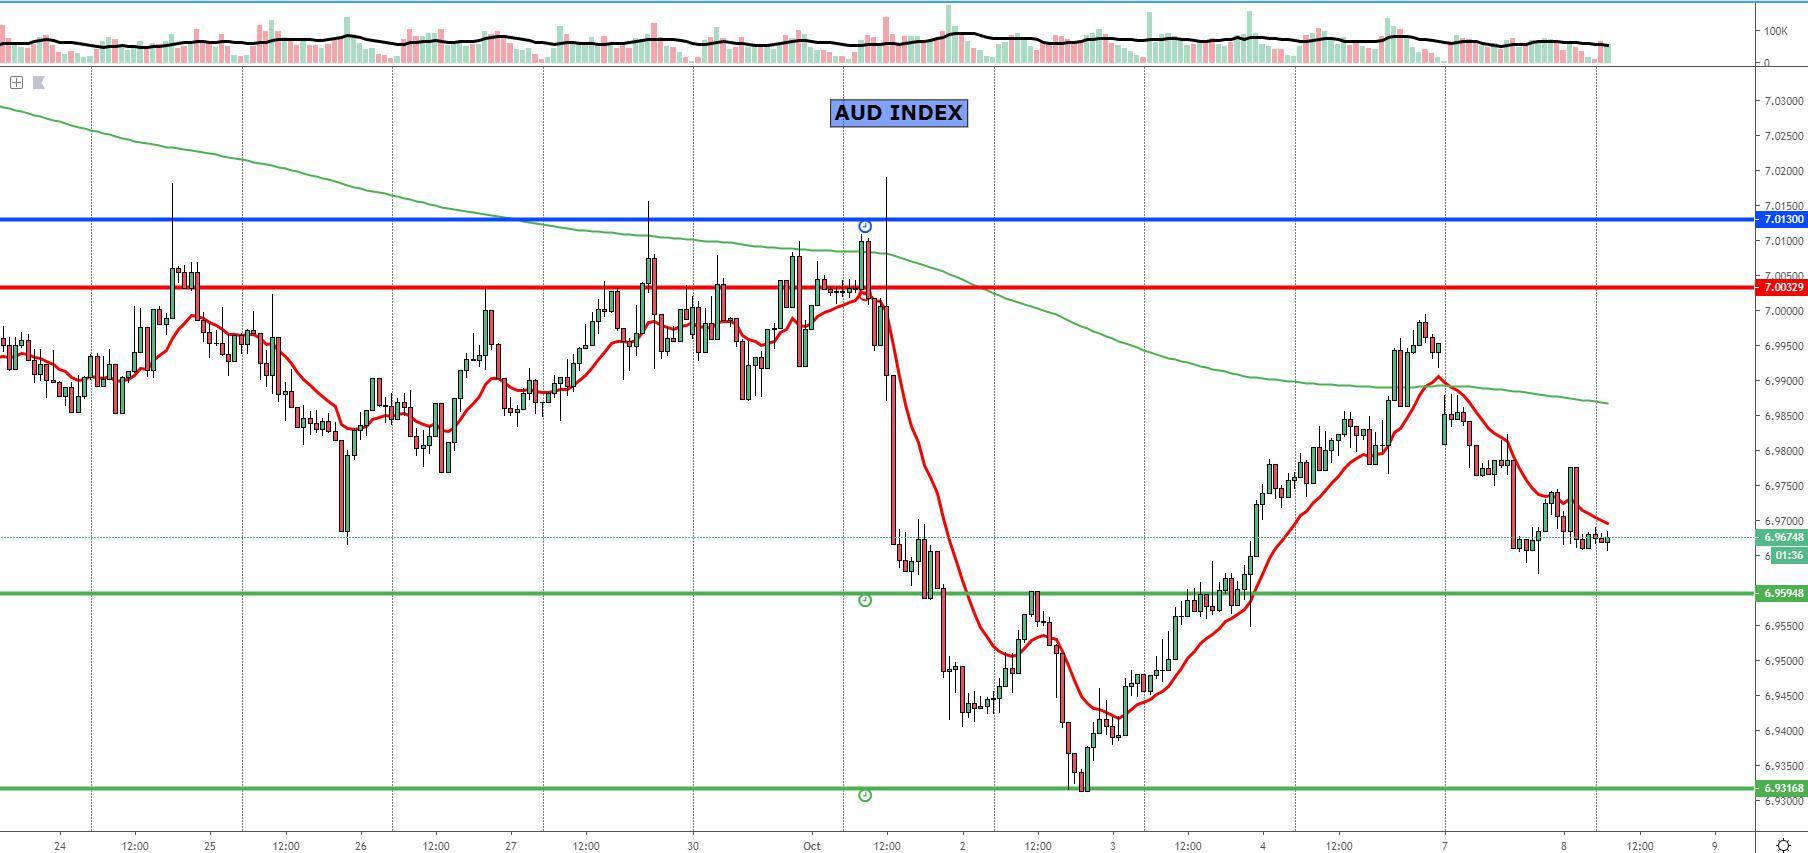
The AUD index is within a short distance of testing what I’d expect to be a demand imbalance level from where buyers will step in as part of the hourly time frame. Note, the index is still trading with an overall bearish bias if one steps out of the lower time frames, with the test of the hourly demand, if/when it happens, to occur below the baseline, which makes it an inherently riskier trade to take if one expect to see a long-lasting buy-side campaign to unfold. To the upside, there is no new clear areas formed at this point until up in the topside extremes, where an untested 8h and daily supply area overlaps within a short distance from each other, where I’d be expecting sellers to return to the market for a fresh sell-side campaign.
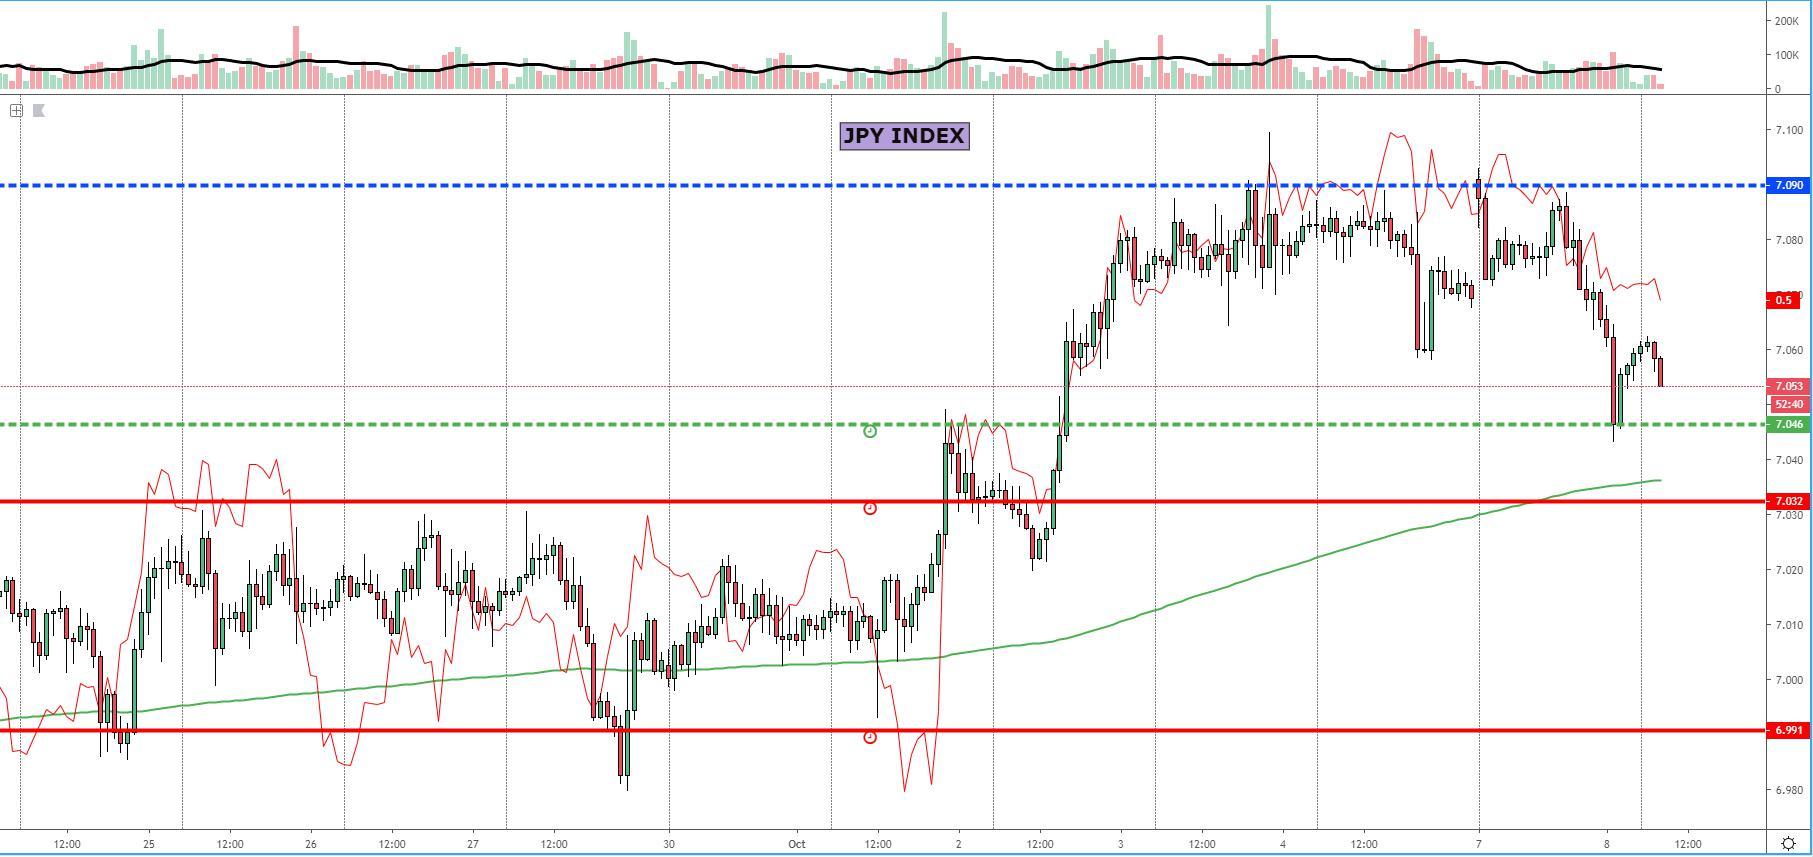
The JPY index sold off away from a tested supply imbalance, which nonetheless held enough credence as to expect further selling interest judging by the renewed sell-side pressure on the back of the US NFP report last Friday. One could have also spotted how the red overlapping line in the chart, which refers to the ‘risk line’ (sp500 + us30y) was rolling over at the time of the last test. The next logical area of support was tested late in the American session, from where a rebound has taken place. Given the impulsivity of the decline and the fact that the level is no longer a fresh one, those looking to engage in buy-side opportunities in the JPY will be better off patiently waiting until a test of a fresh daily support, which comes about 0.2% below the mentioned hourly level. Coincidentally, which strengthens the technical buy-side case, the 13-day ema is interesting around the same vicinity. A pristine area to engage in JPY longs.
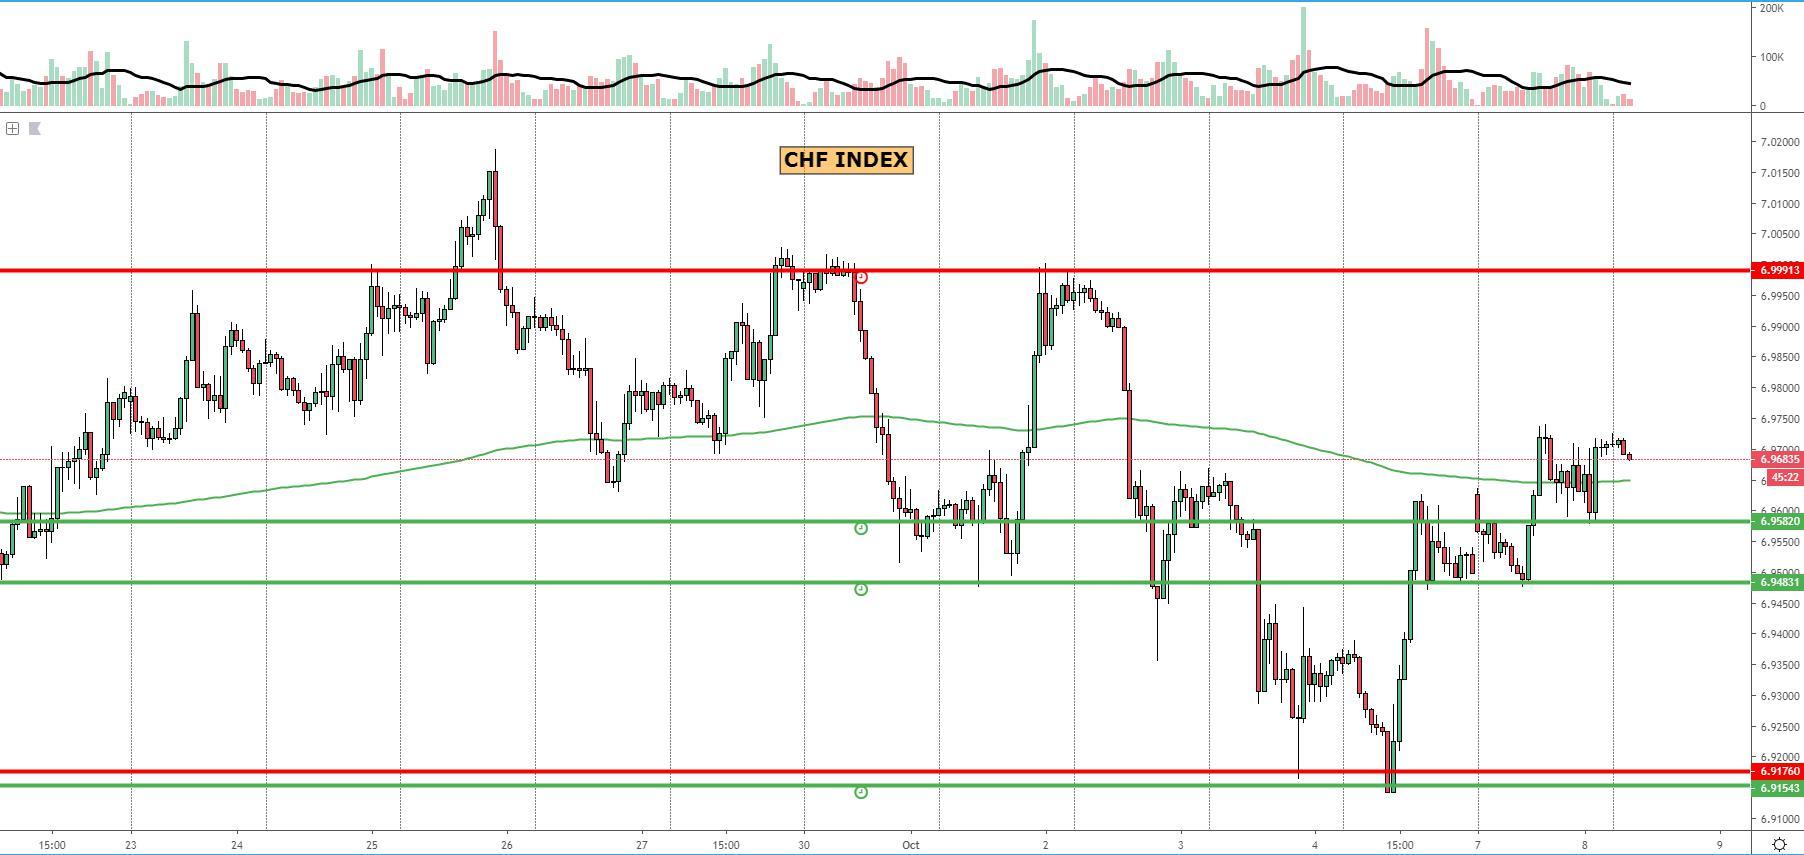
The CHF index has printed new highs, leading to potentially two new hourly demand imbalances to take into account for those interested to engage in buy-side business as value areas. The structure out of the hourly has now clearly turned bullish, with the price a hair above the 13-day ema, in what still appears to be an unfinished upcycle. The room to see further appreciation in the Swissy is definitely available, with a significant vacuum area that poses little upside obstacles until a fresh level of daily supply gets tested, allowing over 0.4% of leeway. Should the newly found hourly levels be broken, any retest of the bottom side of the macro range should see buying interest re-emerge given what’s so far been achieved (break of structure).
Important Footnotes
- Risk model: The fact that financial markets have become so intertwined and dynamic makes it essential to stay constantly in tune with market conditions and adapt to new environments. This prop model will assist you to gauge the context that you are trading so that you can significantly reduce the downside risks.
- Cycles: Markets evolve in cycles followed by a period of distribution and/or accumulation.
- POC: It refers to the point of control. It represents the areas of most interest by trading volume and should act as walls of bids/offers that may result in price reversals. The volume profile analysis tracks trading activity over a specified time period at specified price levels. The study reveals the constant evolution of the market auction process.
- Tick Volume: Price updates activity provides great insights into the actual buy or sell-side commitment to be engaged into a specific directional movement. Studies validate that price updates (tick volume) are highly correlated to actual traded volume, with the correlation being very high, when looking at hourly data.
- Horizontal Support/Resistance: Unlike levels of dynamic support or resistance or more subjective measurements such as fibonacci retracements, pivot points, trendlines, or other forms of reactive areas, the horizontal lines of support and resistance are universal concepts used by the majority of market participants. It, therefore, makes the areas the most widely followed and relevant to monitor.
- Trendlines: Besides the horizontal lines, trendlines are helpful as a visual representation of the trend. The trendlines are drawn respecting a series of rules that determine the validation of a new cycle being created. Therefore, these trendline drawn in the chart hinge to a certain interpretation of market structures.
- Fundamentals: It’s important to highlight that the daily market outlook provided in this report is subject to the impact of the fundamental news. Any unexpected news may cause the price to behave erratically in the short term.
- Projection Targets: The usefulness of the 100% projection resides in the symmetry and harmonic relationships of market cycles. By drawing a 100% projection, you can anticipate the area in the chart where some type of pause and potential reversals in price is likely to occur, due to 1. The side in control of the cycle takes profits 2. Counter-trend positions are added by contrarian players 3. These are price points where limit orders are set by market-makers.