This week Personal Consumption data was released showing weak (but above expectations) growth.
Since 2000 to the end of 4Q2012:
- Population grew 12.0%;
- Inflation 31.9% (using GDP deflator);
- Unadjusted GDP grew 63.4%;
- Unadjusted Personal Consumption Expenditures grew 68.3%;
- Unadjusted Corporate Profits grew 241%.

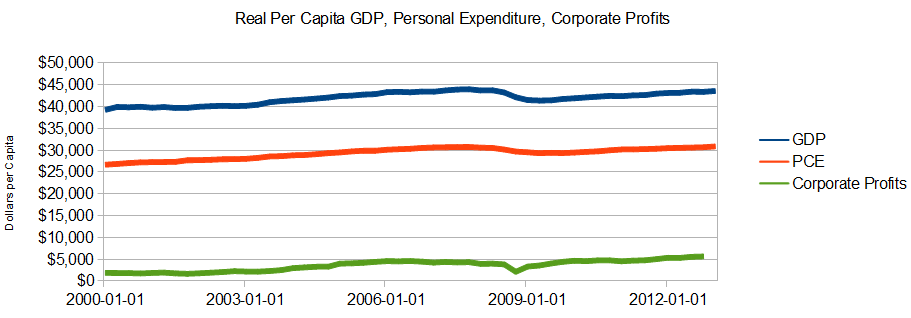
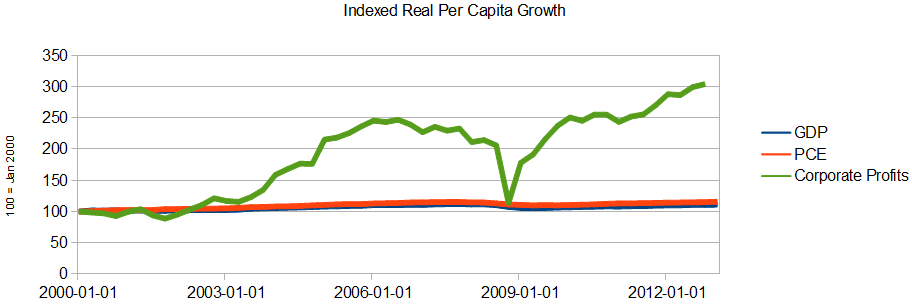
I like to test data by looking at inflation adjusted per capita data. Since 2000:
- GDP has risen 10.5% per capita;
- Personal Consumption Expenditures has risen 13.8% per capita;
- Corporate Profits after taxes have risen 130% per capita.

Is this good and what is the point? If you know the rules you can play the game. This data is telling you the only “growth” sector of the economy is corporate America – and as an investor, this is the place to be.
Second, it tell you that 20% of GDP growth since 2000 has been driven by corporate PROFITS. When two widgets are sold to consumers at $1 each at zero profit, $2 is added to GDP. When one widget is sold to consumers at $2 (with $1 dollar profit), $2 is added to GDP.
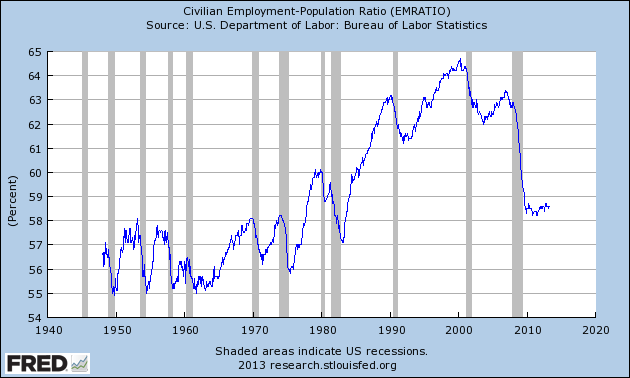
The reality is that a growing element of GDP growth is financial growth for those invested in corporate America – not “growth” for Main Street. As a service economy, the only way I know to measure growth is employment – population ratios and mean income. Employment – population ratio simply tells what percentage of the population is working. Median income removes the distortion of the 0.1% showing the income of Joe Sixpack. Median income is not a real time data series but does have historical information which shows Joe is doing poorly. This tells you the Main Street economy is not really growing.
Whatever your prejudice:
- trickle down money from the business sector is not reaching Main Street;
- trickle down money from government is not helping Main Street grow.
The USA economy is geared towards Main Street consumption (which has been stagnant since 2000) – but has been partially covered up by growing corporate profits influence on GDP. This author is far from being against growing corporate profits. But I am for the growth of Joe Sixpack, and real growth of the USA consumption based economy.
Some believe the evil empire is the banking system which is creating significant profits for an sector that was on the ropes only a short time ago. It is not in the public interest to have a sector profit from money flows as they are taxing the economy because of their existence. From Washington’s Blog posting at GEI Analysis:
Before concluding that higher bank profits leads to a ponzi economy and a depression, the economist Steve Keen has shown –
“a sustainable level of bank profits appears to be about 1% of GDP.”
Unless we shrink the financial sector, we will continue to have economic instability.
Many hold a belief that government austerity will fix the economy over time. I am not a believer that austerity should be the only tool in the toolbox. Austerity will take a further toll on Joe Sixpack, and that is the last thing the economy needs at this point is further damage to Joe.
Other Economic News this Week:
The Econintersect economic forecast for May 2012 declined marginally, but remains in a zone which says the economy is beginning to grow normally. There are some warning signs that our interpretation is not correct – but we will see how these play out in the coming months.
The ECRI WLI growth index value has been weakly in positive territory for over four months – but in a noticeable improvement trend. The index is indicating the economy six month from today will be slightly better than it is today.
Current ECRI WLI Growth Index 
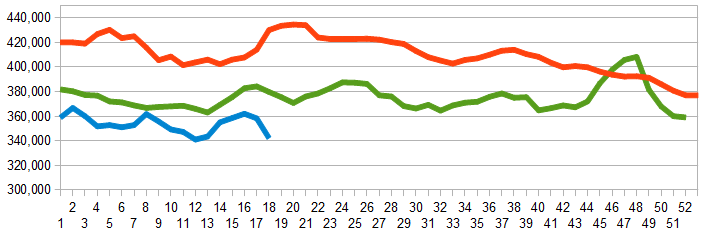
Initial unemployment claims fell from 339,000 (reported last week) to 324,000 this week. Historically, claims exceeding 400,000 per week usually occur when employment gains are less than the workforce growth, resulting in an increasing unemployment rate (background here and here).
The real gauge – the 4 week moving average – slightly improved from 357,500 (reported last week) to 342,250. Because of the noise (week-to-week movements from abnormal events AND the backward revisions to previous weeks releases), the 4-week average remains the reliable gauge.
Weekly Initial Unemployment Claims – 4 Week Average – Seasonally Adjusted – 2011 (red line), 2012 (green line), 2013 (blue line) 
Bankruptcies this Week: Newland International Properties (dba Trump Ocean Club), PMI Group, CPI, [from last week: Yarway, Synagro Technologies, KIT digital]
Data released this week which contained economically intuitive components (forward looking) were:
- Rail movements remain mixed.
- Trade data (imports) is forecasting a slowing economy.
All other data released this week either does not have enough historical correlation to the economy to be considered intuitive, or is simply a coincident indicator to the economy.
Weekly Economic Release Scorecard:
Click here to view the scorecard table below with active hyperlinks
