The focus in the equity world has been on the US dollar, eurod and yen. Will the dollar weaken? Will the ECB cut rates to weaken the euro? Will Japan finally be able to create some inflation by weakening the yen?
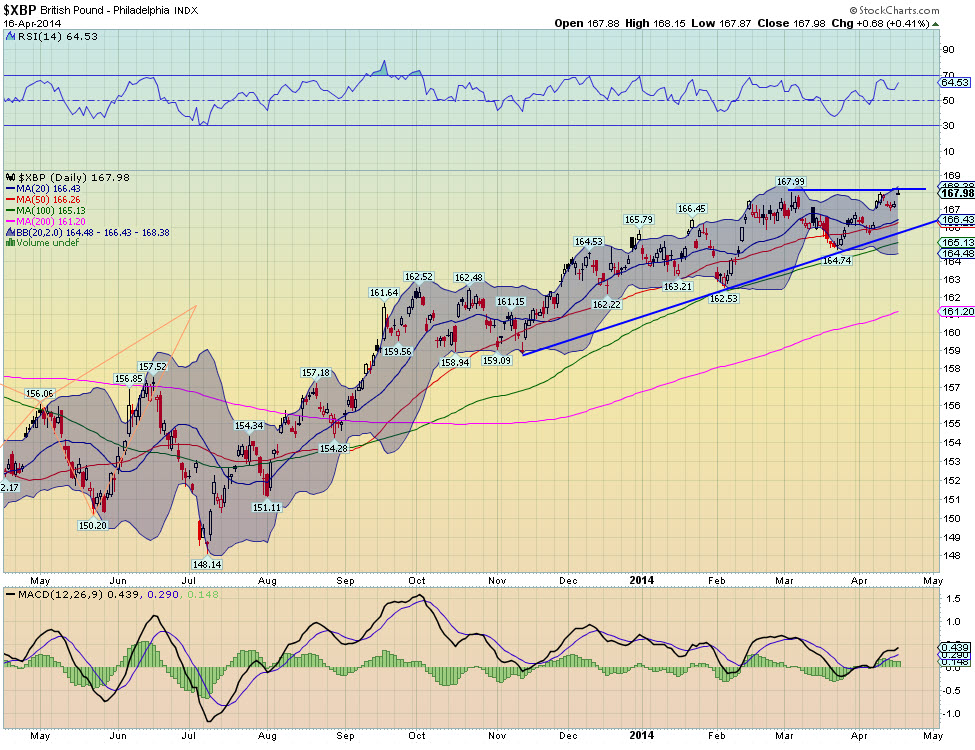
What gets lost in this is that the winner of the currency wars has been the British pound. A quick look at the chart of the currency measured in dollars below shows a clear trend higher since July, nine months. It has leveled a bit recently but the most recent action shows that there may be an opportunity to put on a trending trade in sterling. In technical terms it is testing resistance from a higher low and building an ascending triangle. A break of the triangle higher would target a move to 173.50. That is a big move for a currency.

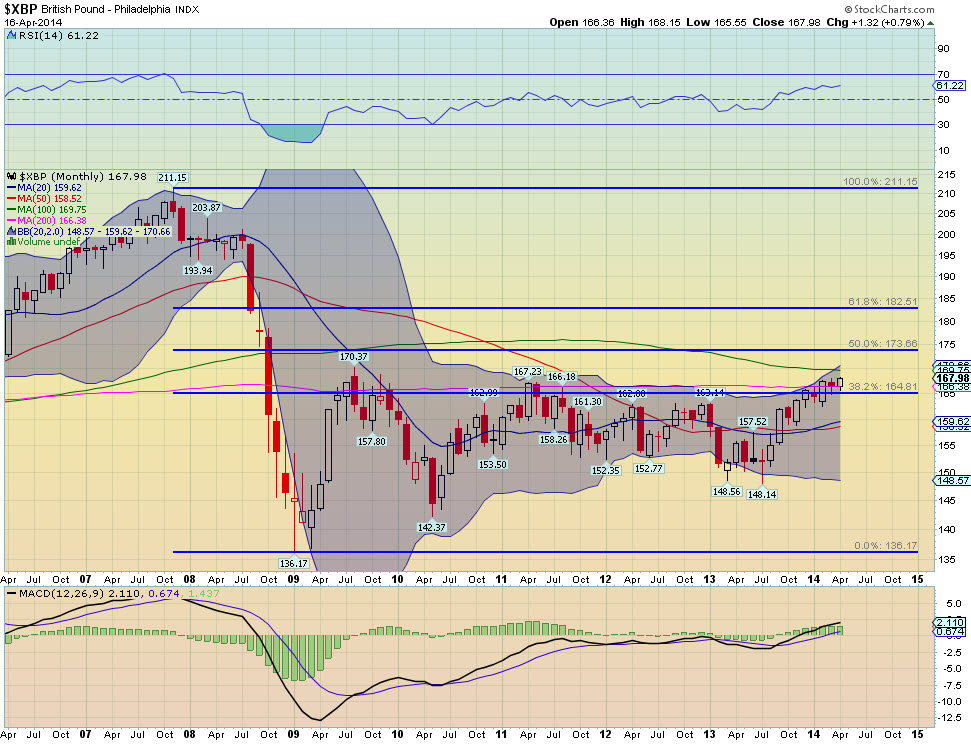
This level has some additional significance. Looking at a wider view at the monthly chart shows that this is near the 50% retracement of the move lower in 2008 at 173.66. So with a move finally getting some space from the 38.2% retracement at 164.81 and the 200 month SMA at 166.38 as a natural stop level it is ready for a trade. For an equity player this move can be played with the Rydex CurrencyShares British Pound Sterling Trust ETF (FXB). Due to the fee structure, a direct play should look for a move over 165.75 on the ETF as a trigger.

Disclosure: The information in this blog post represents my own opinions and does not contain a recommendation for any particular security or investment. I or my affiliates may hold positions or other interests in securities mentioned in the Blog, please see my Disclaimer page for my full disclaimer.
