The main theme for tomorrow obviously will be the FOMC statement and while we expect nothing new beside rate hikes to come, traders would be more interested to find out if there would be series of rate hikes expected until the end of this year. Today USD lost a lot of ground against the commodities currencies with CAD being shinier, while euro for the day was found on defensive grounds. These are likely position adjustment prior to the big news even coming half way into the North American Session.
We can expect some dramatic moves upon the statement and USD majors are likely to make a lot of noise and would likely clear the path for the dollar's next move.
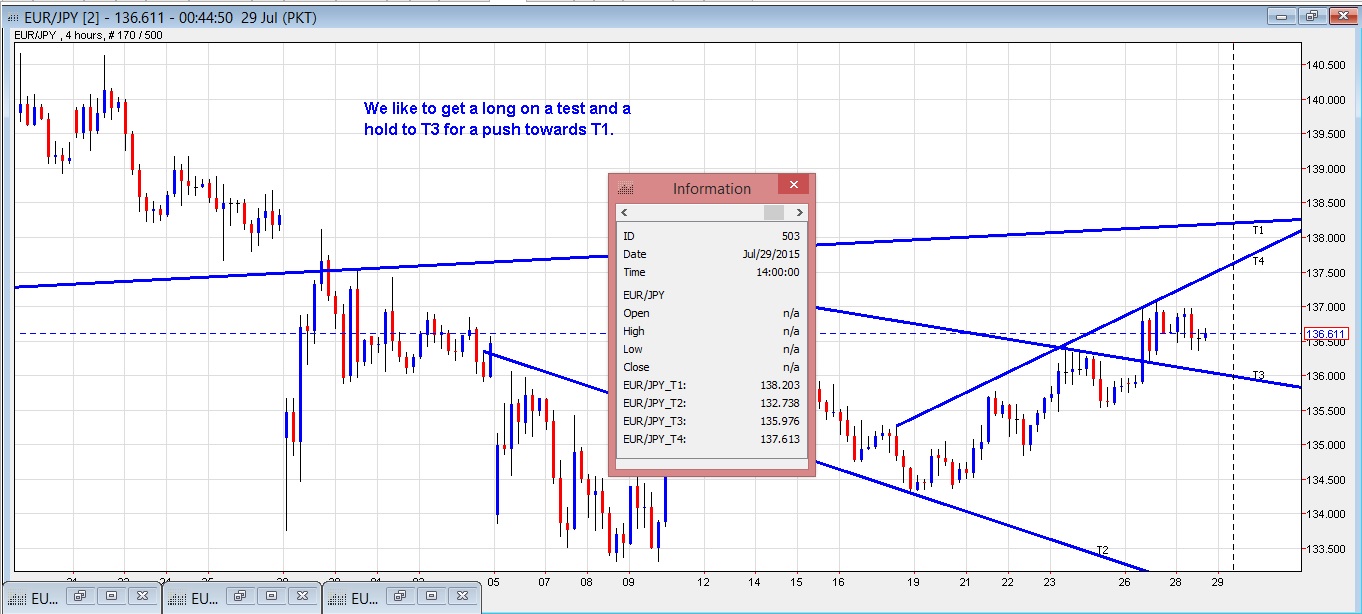
We are looking for buys on the pair close right around to 136 handle or T3 on the chart for a possible move towards 137.6X with potential run to test into 138 handle.
With Greece able to make a deal with it’s creditor, the EURO started to find support and saw a rally in past few days with JPY/EUR getting lifted off from under 133.50 and been able to make a run to 137 zone. We expect this run up likely to continue and make it to 138 handle.
We are looking to get a re-test to the very current break out we can spot on the 4-hour charts coming to 135.9X and a hold to consider going long on the pair for listed targets.
Hence from risk to reward ratio, we are choosing a current breakout trend line retest to enter longs preferably right around to 136 handle for a potential move into 138 handle.

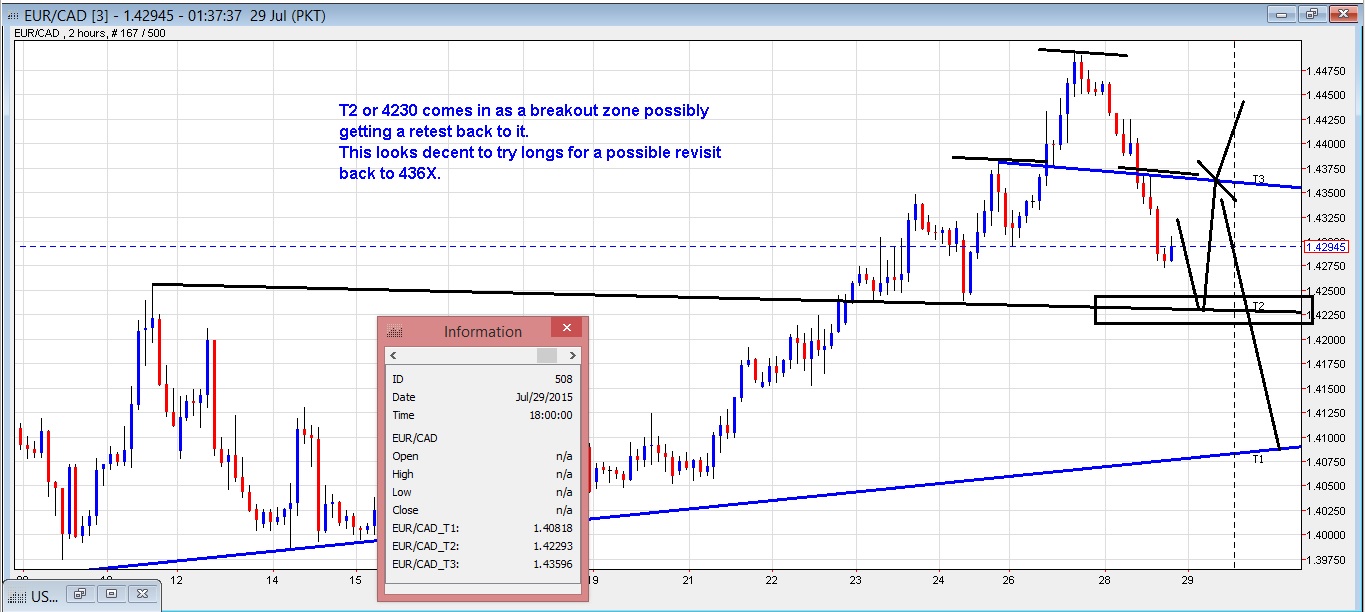
We are interested in trying longs off 4230 zone if we get a to test it for a possible move towards 143.6X.
This level holds a lot of importance for various reasons. To start off, it looks like a breakout zone and having few attempts to it the price took off and now possibly about to get a retest. Secondly it comes in as the possible neck of the head & shoulder it is depicting.
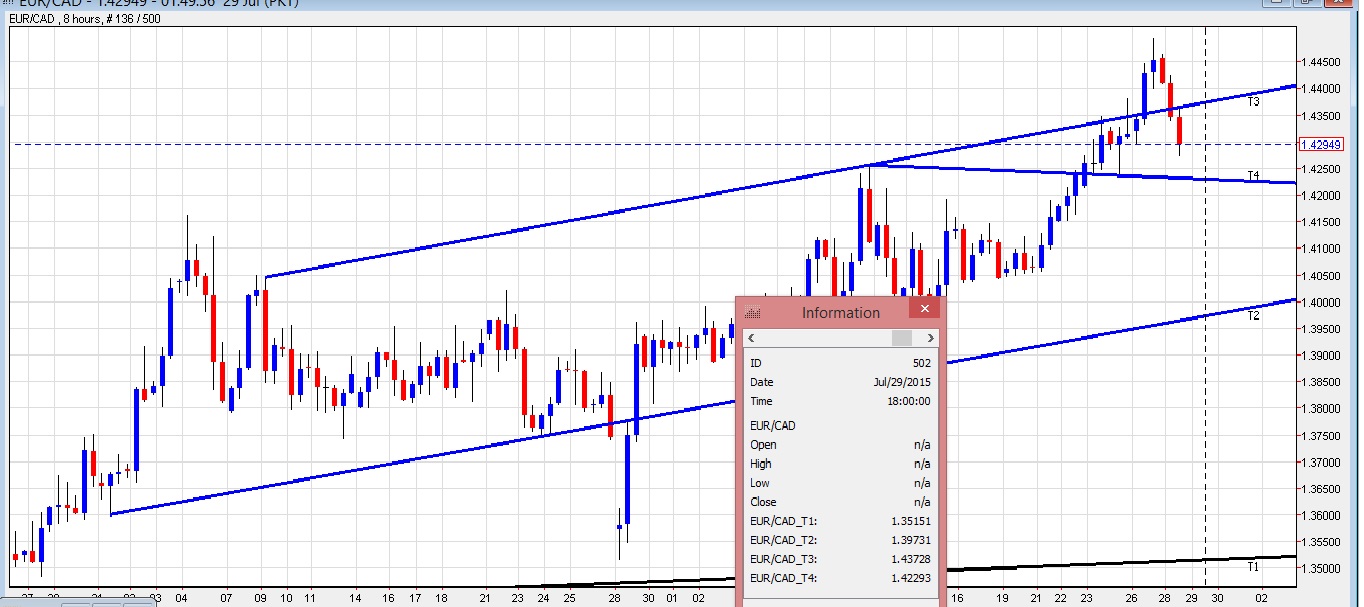
Lastly, the 8-hour shows we were not able to maintain the break of the resistance T3 and with price slipping and closing back under to it; can cause more downside to the pair.
To reiterate; we will use a test of 4220-3X to enter longs for a possible move towards 436X and alternatively can sell from 437X for a possible break under 422X and a deeper decline towards sub 4100 handle.


Our layout done on Thursday is still valid. Please review Thursday’s post.
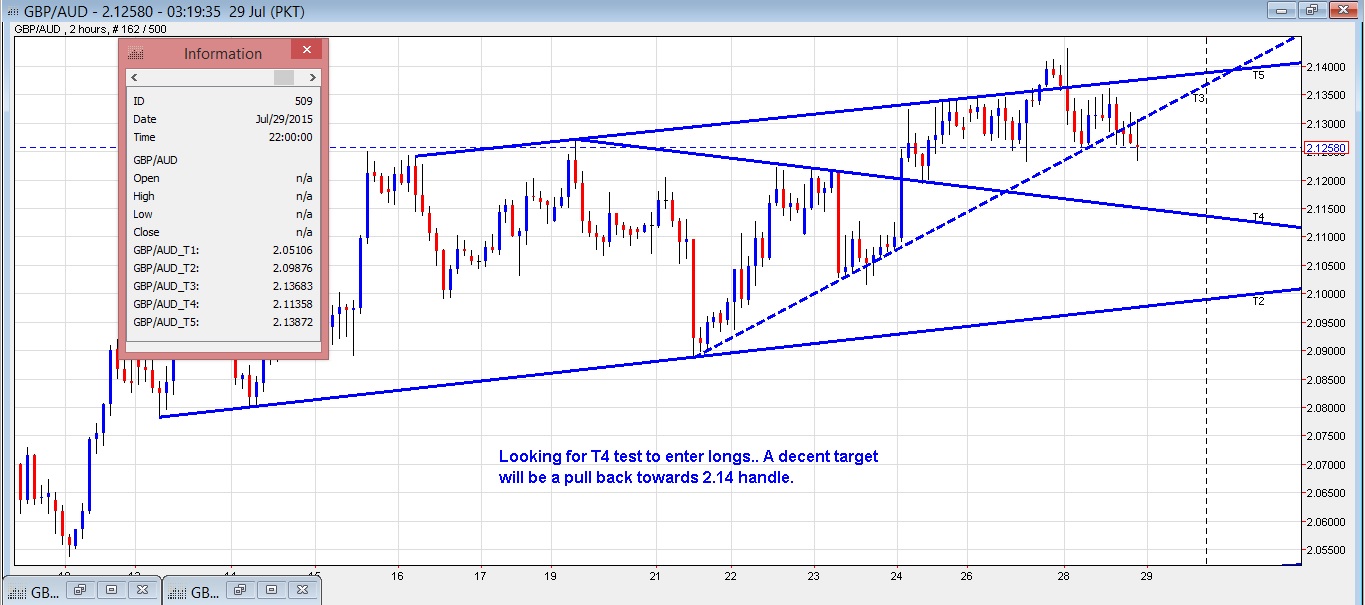
We had the shorts triggered on Tuesday on break and a close under T3 upon its retest. We took a small profit and looking to use the T3 test once again now to enter shorts with target towards T4. This target on the intended shorts comes in as a zone to enter longs for a pull back towards 2.14 handle.
With FOMC later today, a lot of fireworks are expected and so any more lower towards 2.114X can be taken as an opportunity to try longs for a possible retest close to the 2.14 handle. From risk to rewards ration, this can be a decent trade with fundamentals on GBP coming in stronger than the AUD.

