GBP/JPY
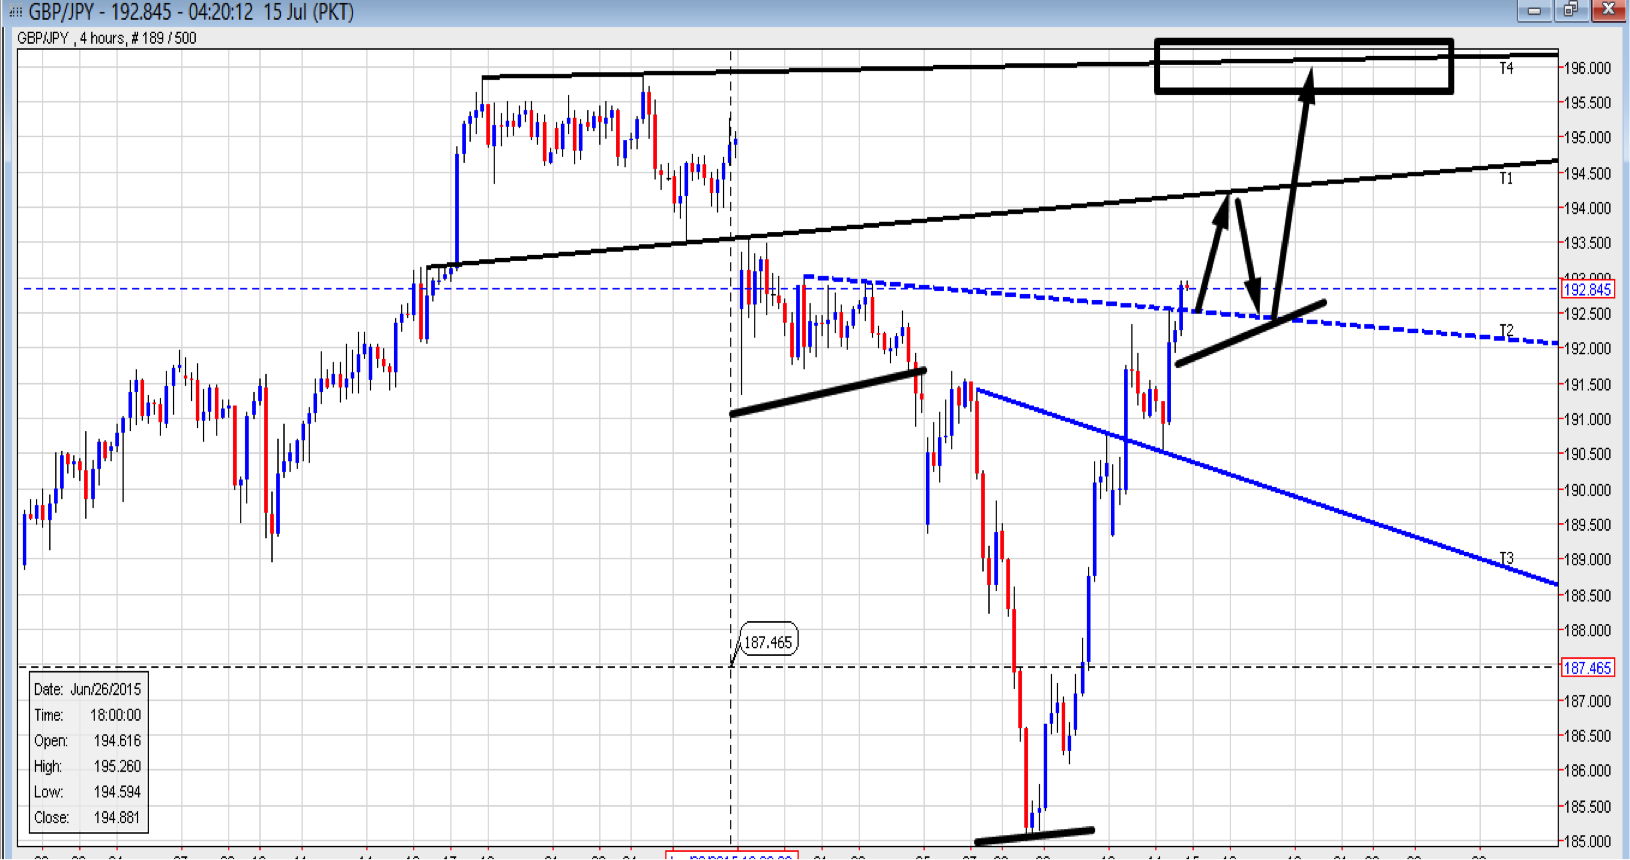
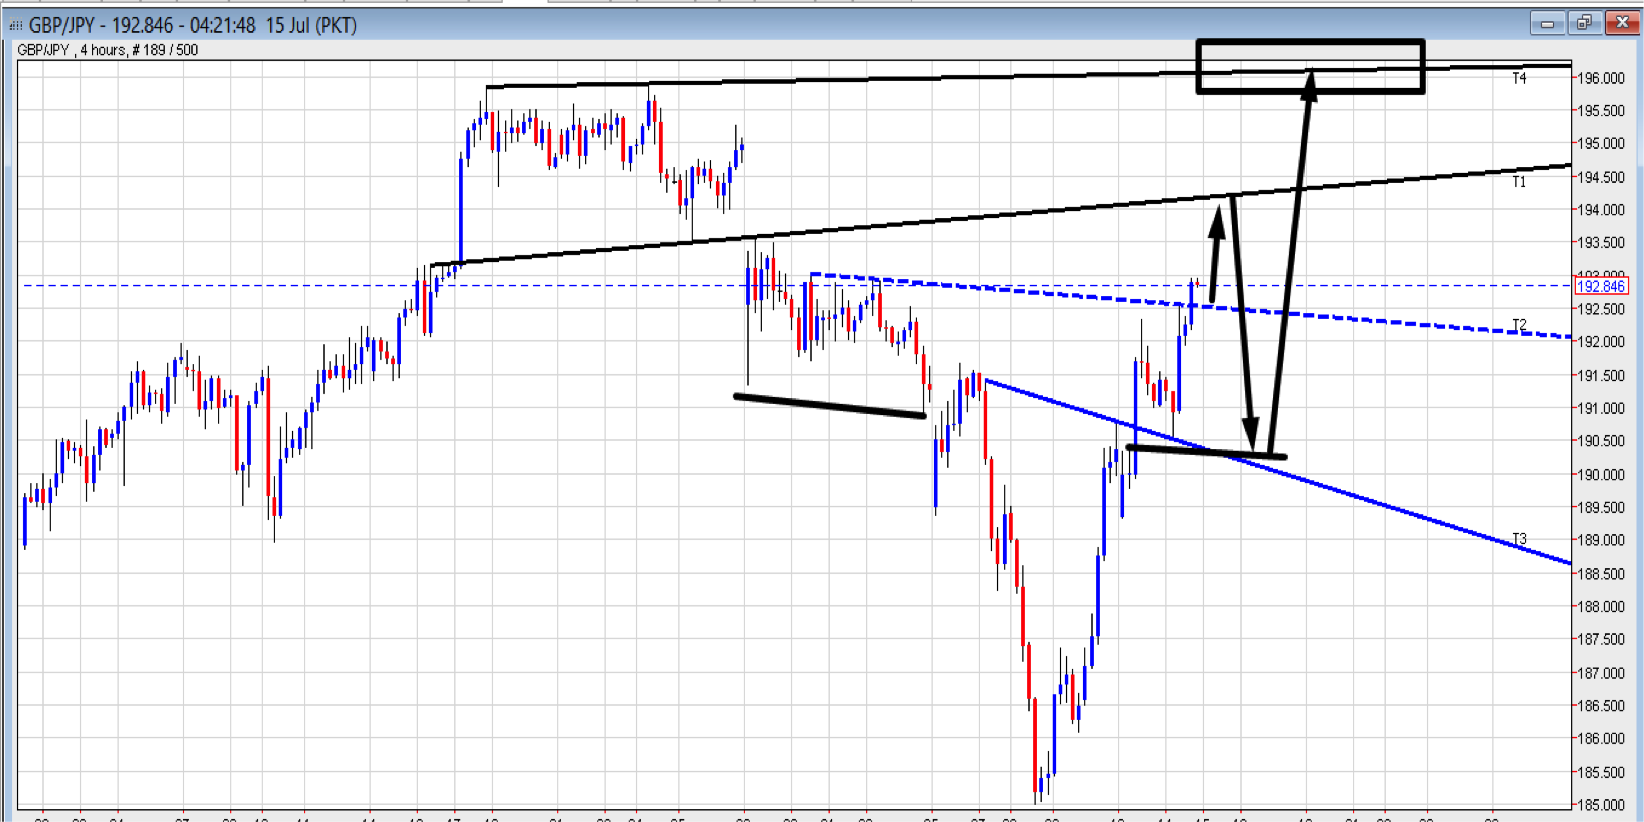
The pair is showing a possible Inverse H&S and as such is expected to hit higher to 196.10-20 zone. This been the possible neckline.
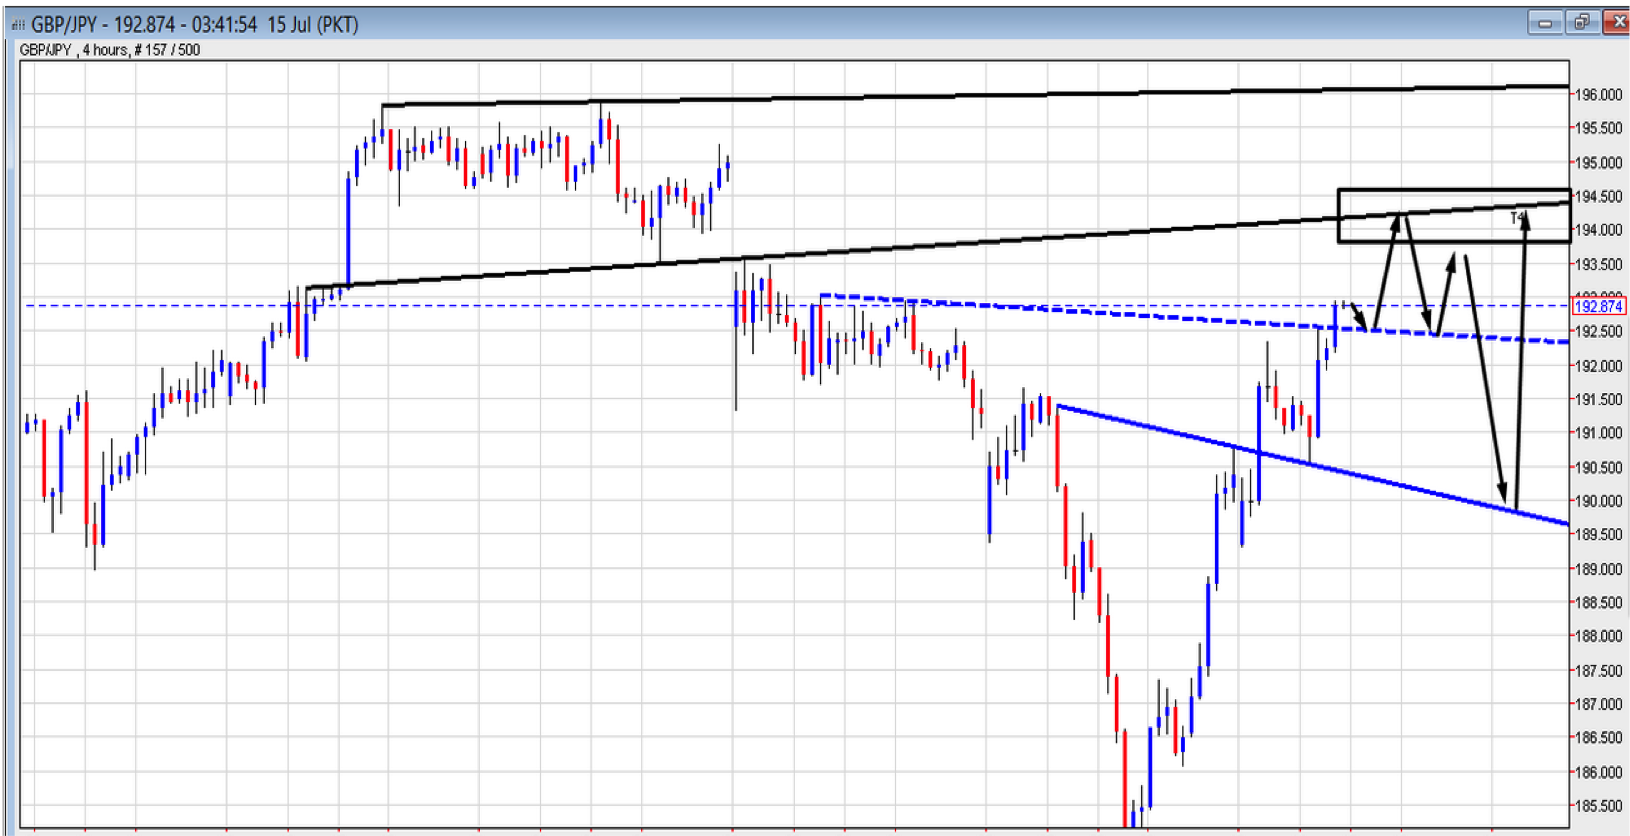
However for the current price action expecting it to test 192.40ish support; which is a current break point and if holds to here can see a move unfolding for a 194.05-15 resistance zone. This level can provide an attracting opportunity to set shorts for a revisit down to 192.40-5X. In any case the price can break under the dotted trend-line or 192.4X; and can expect a deeper fallout towards 189.XX. This level comes in as possible Right Shoulder zone of the Inverse H&S it is depicting. Taking a long off here can yield attractive risk to reward opportunity as a bounce off here has potential to make it to the expected neckline.
Overall pattern on the pair pins it bullish for a 196.10-20 and it been a neckline of the Inverse H&S. Alternatively if a retrace ends up coming off 194.05-15 and it tests 192.40ish there is a possibility that it carries a bounce heading to test 196.10-20.
Trade idea is to try to sell 194.05-15 and if the levels holds try to look for initial 50-70 pips with potential run lower to 192.4X.
Today we have BOJ press conference along with Monetary Policy Statement that can cause big move on yen along with important releases on the GBP. The pair can make big moves and as such some caution is required.
EUR/CAD
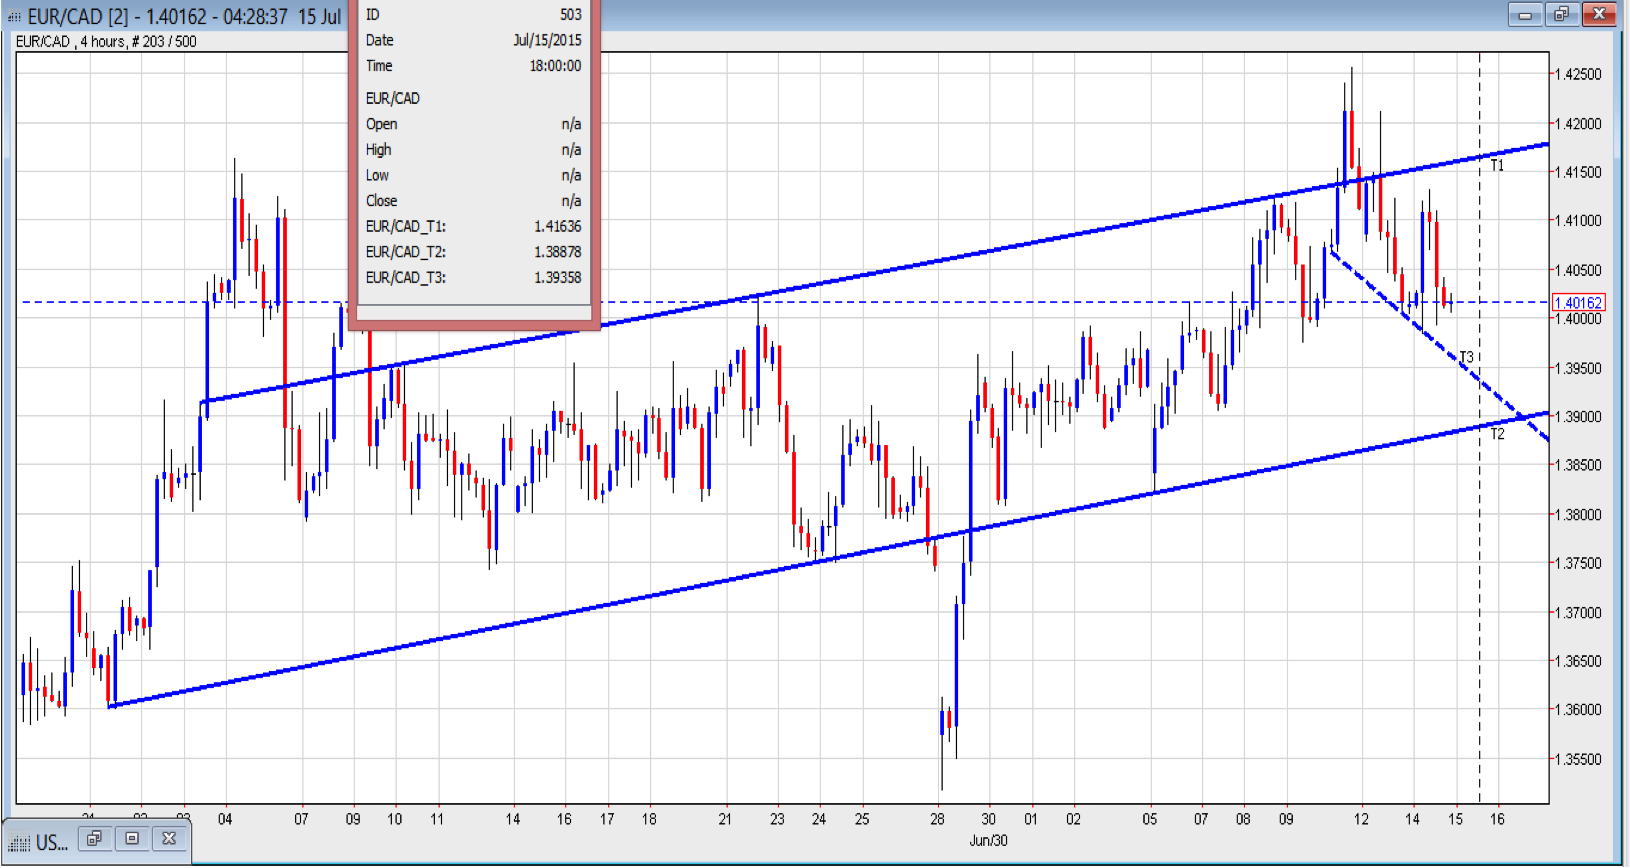
The pair is currently ranging within 260 pips within the T1 and T2 channel. The overall direction on the pair is mix with range trading preferred till a break to either side of the channel is achieved.
Current price action favors a possible attempt higher toward 416X and as such we like to try longs off the dotted Trend-Line which is acting as a declining support. Will look for a 3935-40 test and if the price holds to it would attempt longs for a possible push towards 416X. Alternatively; considering it is ranging the 416X test and a hold to it encourages to try shorts for a possible drop lower to around 3900 handle.
GBP/AUD
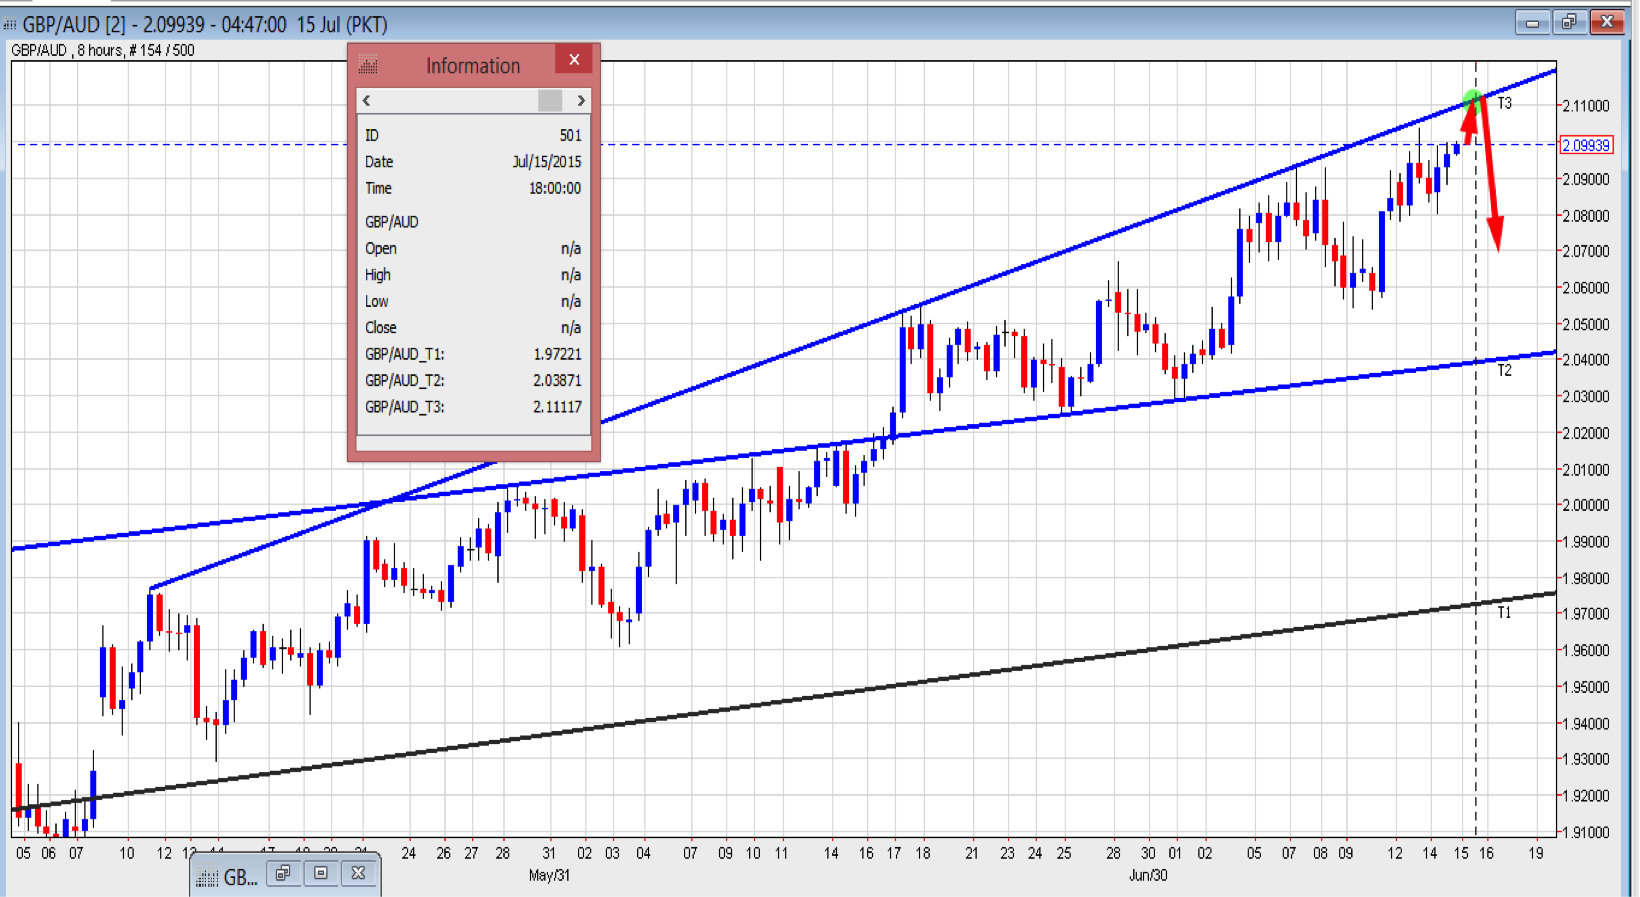
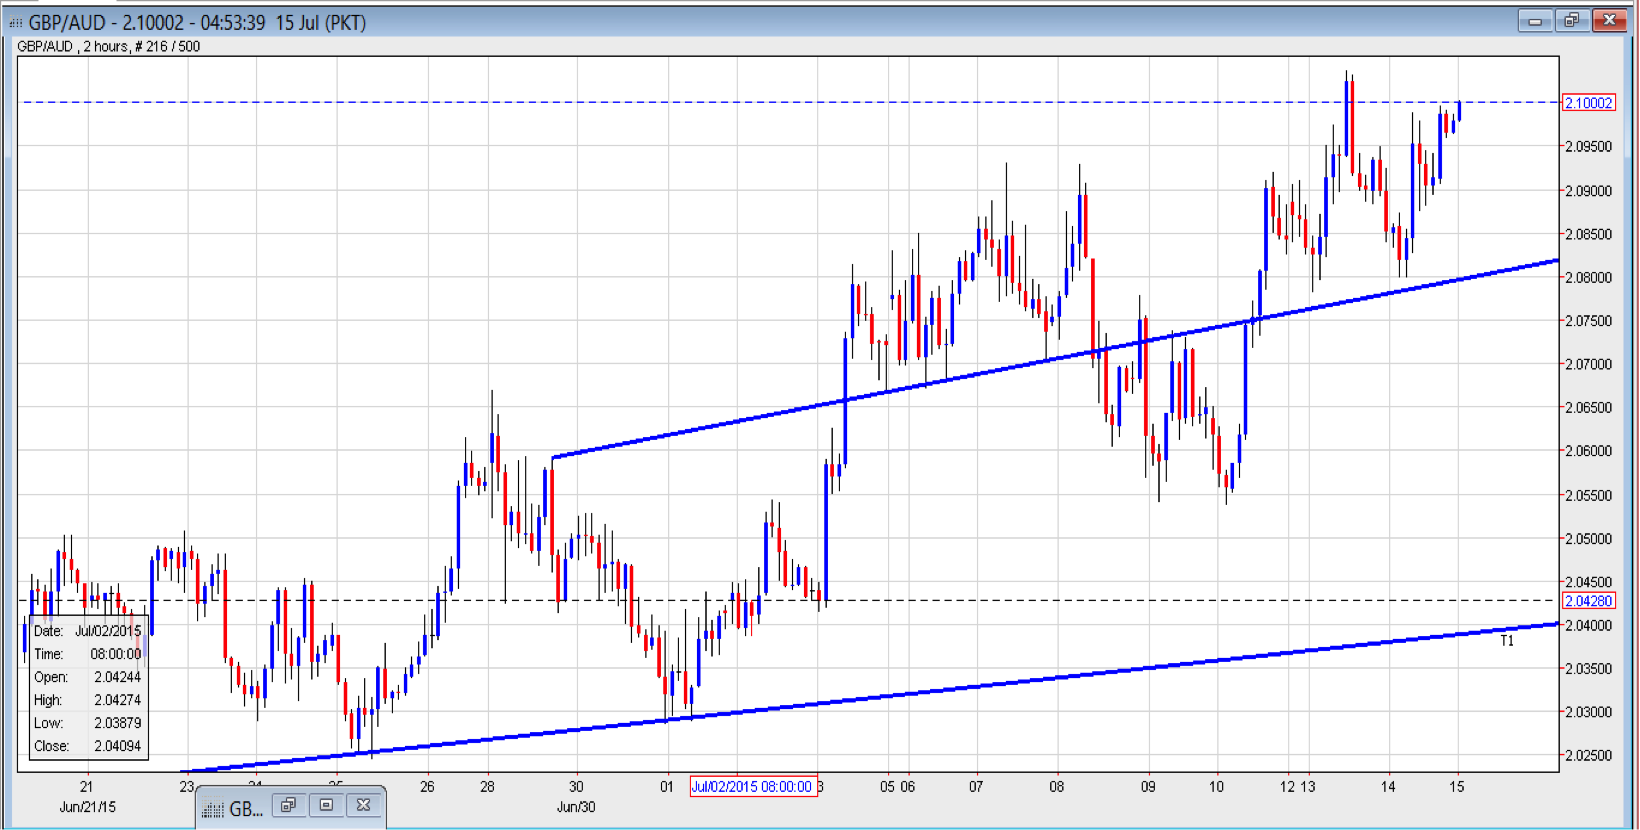
The pair has been making minor new highs and retracing some before heading back up again. There is a higher possibility that the pair is due for some bigger correction as it shows exhaustion and fall down to 2.04XX would be preferred considering it can put up a temporary top into early 2.11XX.
With this in mind; we would look for yet another minor new high towards T3 zone on the 8 hrs chart. A halt to this level encourages to enter short for a possible move to early 2.08XX as per the 2 hr chart with potential run lower to 2.04XX on a bigger picture.
Today we have important news from China that can cause big move on the Aussie along with important releases on the GBP. The pair can make big moves and as such some caution is required.
