We had a wonderful day yesterday where we were able to catch up on slower days of the week and get to make the most on the crosses especially the GBP/NZD and GBP/JPY. EUR/CAD finally decided to join in as well along with AUD/USD doing those ranges as we were expecting.
We hope to continue on the pace if we could and looking ahead we have some decent setups for the day to look for. Friday we will see the NFP release and that very well could set the pace for next directional move on the US dollar.
AUD/USD
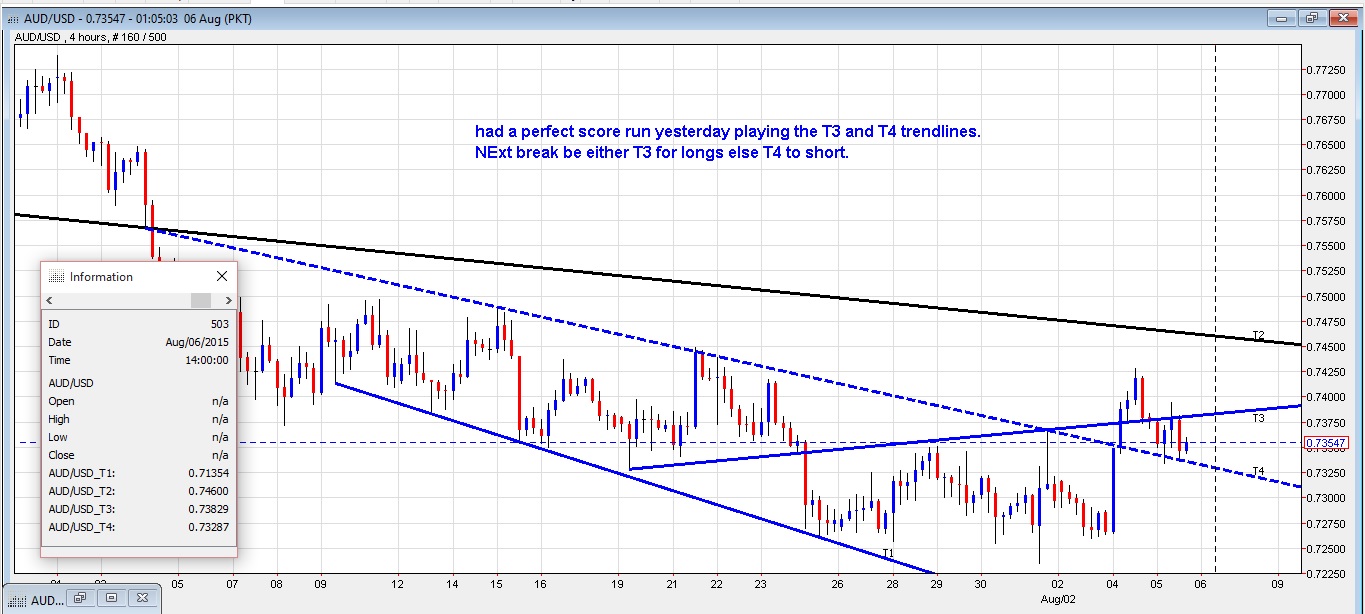
We have the same layout from yesterday and price did exactly as was expected. Not changing anything but looking to play break of T3 to long or T4 to short.
AUD put in a spectacular show on RBA statement when Governor Steven shied away on suggesting they prefer lower AUD provoking rally that surprised most of us. Now back to reality and going data dependent; AUD failed to keep up its posture and if it can’t break and close higher to say 7385; the downside just may gather momentum and can expect it to test 7260 zone once more if breaks under T4 trend line.
Hence we keep things simple and happy to play break either to above T3 for a possible move heading for a 746X and to short from there off; else break under T4 for an initial move to 7260-70 with potential run lower to 721X. The move lower suspecting it to be a faster one if happening. With news event on AUD (Employment) early in Asia; can expect some volatility and a possible break out of the range.
Can look to play break out of T3 Or T4.
EUR/JPY
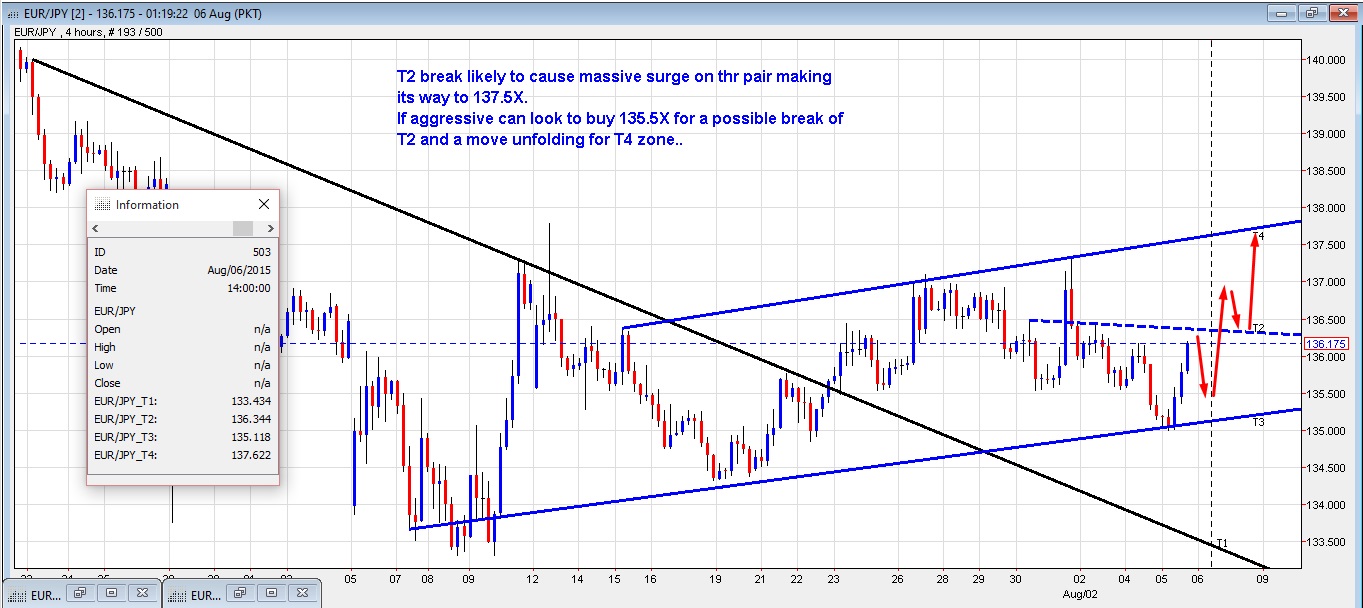
The pair if can retrace lower to 135.5X zone looks attractive to buy considering we stay higher to yesterday’s low print for a possibly move to 136.3X that comes in as a break point and a gateway to build a move for a 137.6X zone. The later as in T4 trend line zone comes in as a decent looking resistance to try sell if comes into play.
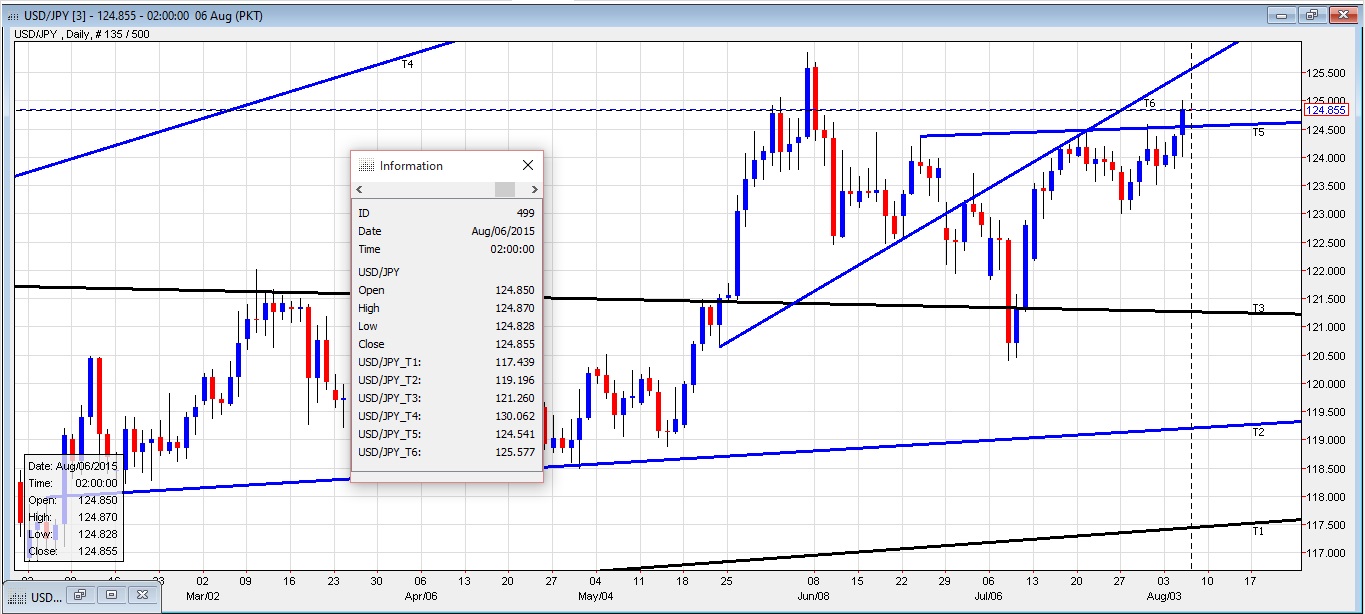
The initial big move on USD/JPY and it’s crosses to the north side been attributed to the 124.50 breakout and the stop-loss above to the break point fueled into the rally with the pair posting a print of 125.01. The next major resistance on the pair comes to 125.55-60 and if on retrace it can hold to 124.50 zone; the pair likely to continue up north. There isn’t any major news event for JPY til Friday where we have Monetary Policy Statement so we suspect technical should do what they are portraying. Hence with euro up on a bounce from 10850 zone; can expect the continuation on EUR/JPY rally to challenge 136.3X and if can break it; to make way for a 137.6X zone.
Hence, we like to get longs in on a retrace ideally to 135.50 zone if coming into play, or else if aggressive we can look to long above 136.35-38 break for an initial move to 137.10 with potential run higher to 137.6X and alternatively reversing from there.
Likely bull move to be seen on a break higher to T2.
125.55-60 exepcted resistance if holds above to T5 zone on a retest.
NZD/USD
We are looking for newer yearly lows on the pair towards lower 644X on the current move and will attempt longs off there for an initial 40-50 pips with potential run higher back to the break point or T2 trend line.
Once resilient, NZD/USD is free falling with no immediate bottom in sight. There are number of reasons for the free fall on the pair. To start off we have dovish RBNZ with possibility of more rate cuts by the end of year really and this alone isn’t helping the pair when US is bent on hiking. To add to insult, increase in unemployment, falling diary prices, inflation at all time low and weaker data overall is not giving any chance to the pair to muster strength and try to stage a meaningful correction.
Hence, we can use a retrace to T2 trend line to set shorts up if the price ends up holding to it and target lower 644X and attempt longs from it for an initial 40-50 pips with potential run back to testing T2 zone.
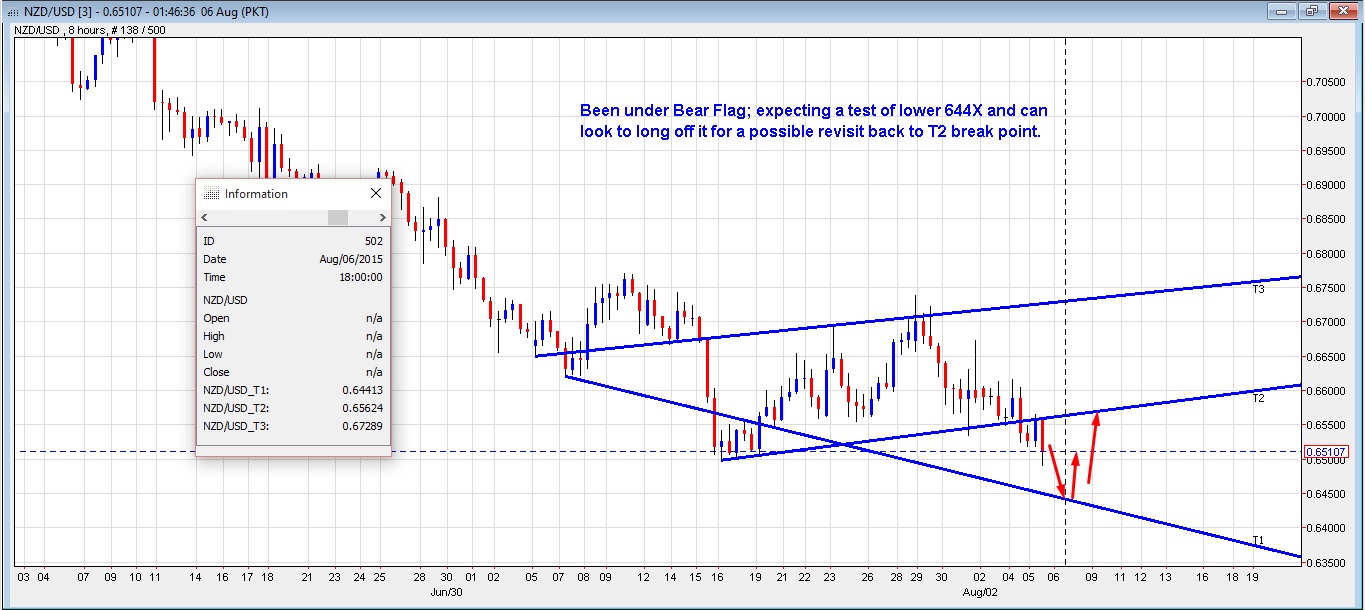
Been under Bear Flag 644X should get tested out and can try longs off there.
XAU/USD
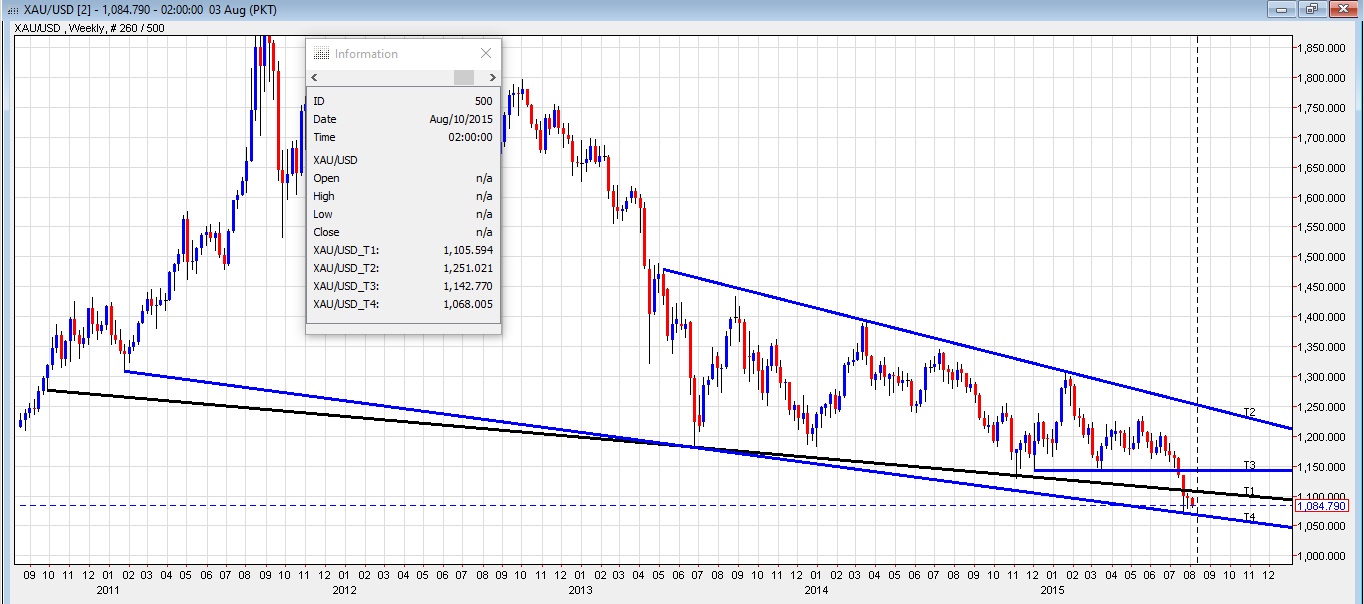
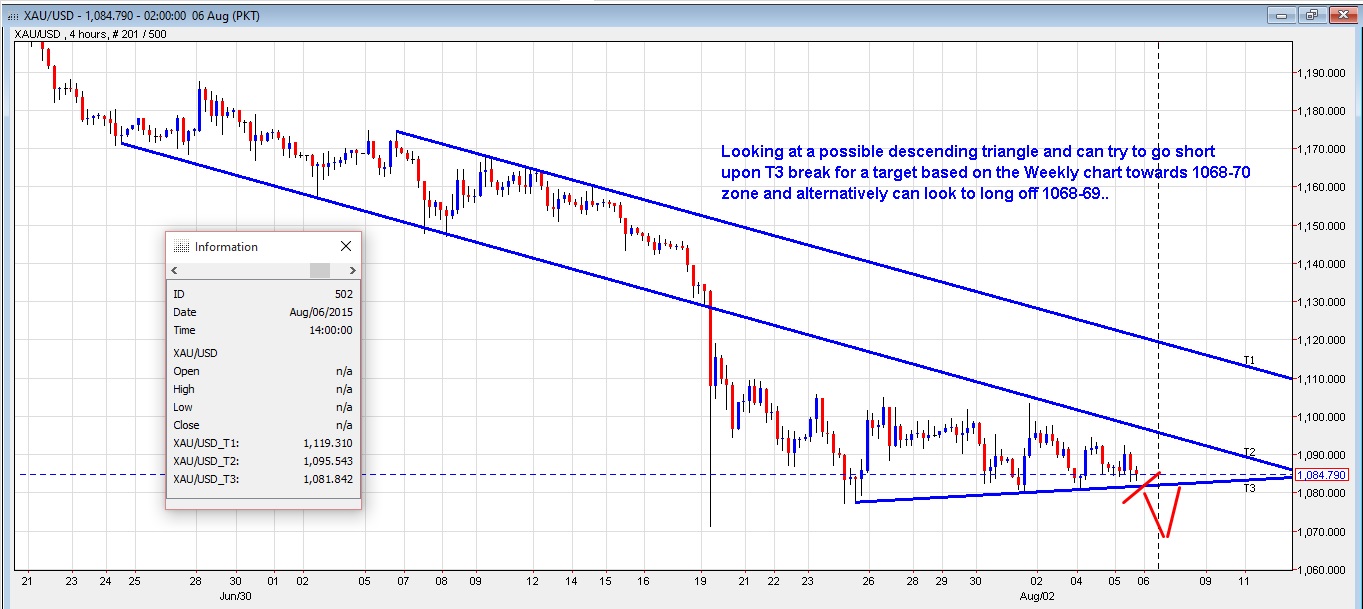
The technical outlook looks bearish on the gold where there is a higher probability that it is likely to test the low of the year one more time. We are looking to sell the break out of the descending triangle or T3 trend line for a possible move to 1068-69 and alternatively buy from there.
The commodities in general along with bullion are finding no taker for the moment and unless gold can hold to the weekly support towards 1068-70; there is a looming danger for the drop to exceed under the psychological 1,000 level.
The 4-hour chart puts in a descending triangle pattern and as such a break can cause the slide to meet support on the weekly chart. Hence, we are looking to sell the break under the triangle base for a possible drop to 1068-69 and if this level holds we like to enter longs to see if we can put in double bottoms and get a bounce making it’s way back up higher to 1082-84.
Possible Descending Triangle in Play.
