All of the major market indexes hit new all-time highs as the fiasco in Washington was put behind us. The market's long-term trend and momentum strengthened as did the intermediate outlook with this week’s advance. With various indicators not yet at extremes, the current rally may continue into the coming week before taking a breather.
S&P 500 Member Trend Strength
As shown below, the long-term outlook for the S&P 500 is clearly bullish as 87.4% of the 500 stocks in the index have bullish long-term trends, up from a reading of 85% two weeks ago. The market's intermediate-term outlook has also improved, jumping from 50.4% two weeks ago to 58.6%, putting it on the verge of an upgrade to bullish territory. The market’s short-term outlook softened from last week’s 77.2% reading to this week’s 56.6% level. What is most important is in the market’s strong long-term outlook, which is still deep into bullish territory and does not suggest a market top is forming.
Note: Numbers reflect the percentage of members with rising moving averages: 200-day moving average (or 200d MA) is used for long-term outlook, 50d MA is used for intermediate outlook, and 20d MA is used for short-term outlook.
The most important section of the table below is the 200d SMA column, which sheds light on the market’s long-term health. As seen in the far right columns, you have 87% of stocks in the S&P 500 with rising 200d SMAs and 84.8% of stocks above their 200d SMA. Also, all ten sectors are in long-term bullish territory with more than 60% of their members having rising 200d SMAs.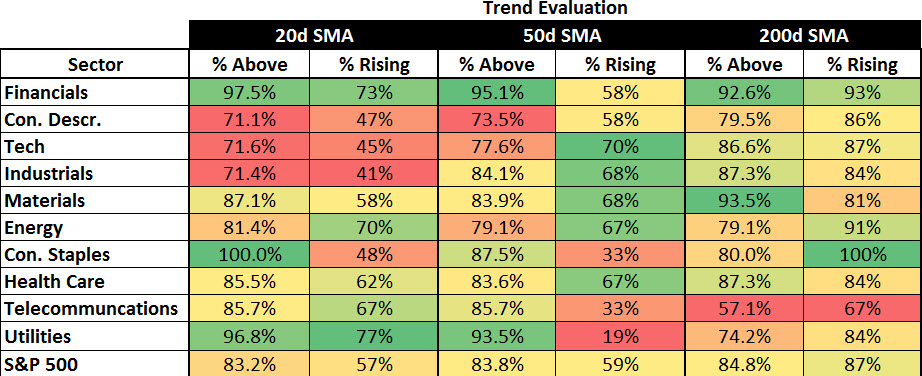
S&P 500 Market Momentum
The Moving Average Convergence/Divergence (MACD) technical indicator is used to gauge the S&P 500’s momentum on a daily, weekly, and monthly basis. The big change recently is that the S&P 500 saw a daily MACD buy signal this week. The weekly MACD is still a hair away from moving to a buy signal, which, if it is able to in the weeks ahead, will be the first weekly buy signal since the middle of July.
Digging into the details for the 500 stocks within the S&P 500 we can see that the daily momentum for the market ticked up sharply from last week’s 77.2% reading to this week’s 82%, which pushed the market’s short-term momentum from neutral-bullish territory to bullish.
The intermediate momentum of the market also improved from 42% to this week's 52% reading, an upgrade to neutral-bullish territory.
The market’s long-term momentum remains solid at a strong 79% this week, up from 77% two weeks ago.
While it is encouraging to see long-term momentum in bullish territory, it is concerning that weekly momentum remains at only a 52% reading. The market’s long-term momentum is heading back up after declining since July and we will have to see in the weeks ahead if we continue to get negative divergences between the S&P 500 and its monthly and weekly momentum numbers.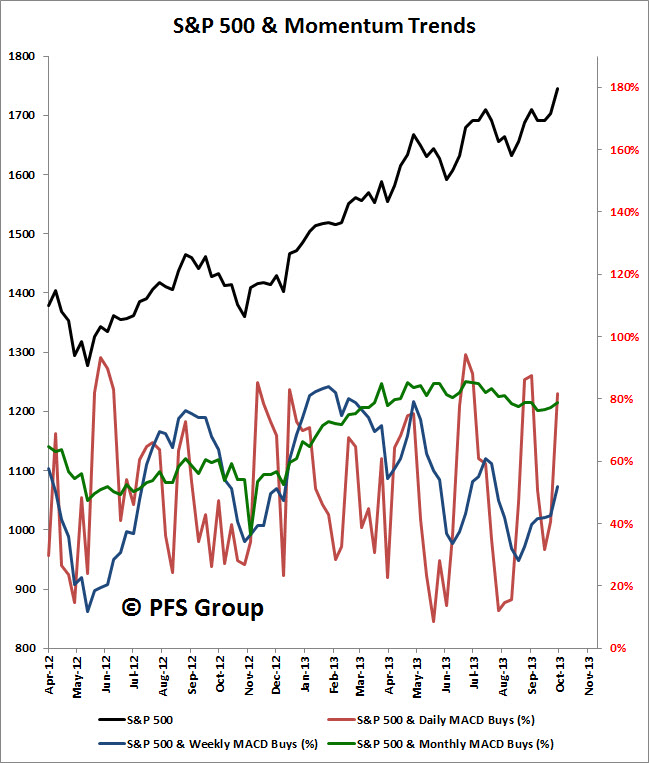
52-Week Highs and Lows Data
The insightful Lowry Research Corporation conducted a study on market tops recently (click for link) in which they looked at all major market tops since the Great Depression and found selectivity is a hallmark of all market tops. Simply put, participation in the bull market fades as individual stocks enter their own private bear markets well before the market peaks. On average, 17.26% of stocks were at or within 2% of their 52-week highs on the day the market peaked while 22.26% were off by 20% or more from their highs, indicating more stocks were experiencing bear markets than were participating in rallying to new highs. For this reason, a look at the 52-week breadth of the markets is helpful in detecting an approaching bull market top.
The market continues to display impressive internals that do not suggest a market in danger of rolling over into a bear market. For example, there are 38% of stocks within the S&P 1500 that are within 2% of their 52-week highs while only 9% are experiencing bear markets, a comfortable margin relative to the average found by Lowry Research. The S&P 600 (Small Caps) shows the weakest margin between those near new highs (36%) and those in bear markets (14%). 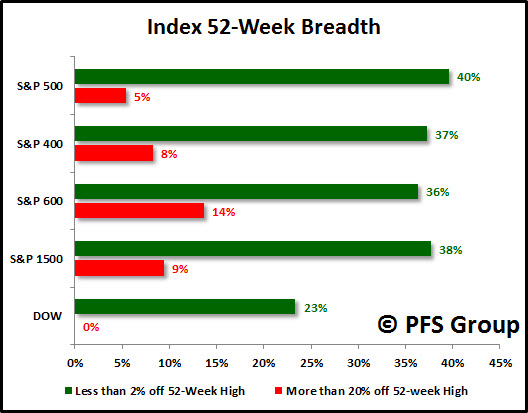
The current market leaders are energy, healthcare, and financials as these sectors have the highest percentage of members in their group that are within 2% of a new 52-week high and very few members that are currently experiencing a bear market (20% + decline), if any new 52-week lows. This is bullish as two of the top three sectors are cyclical stocks (tracking economic expansions), and the fact that these are the strongest sectors is encouraging. Of note is that the telecommunications, utilities, and consumer staples sectors have the fewest percentage of members near 52-week highs. This is significant as these defensive sectors tend to act as market leaders near major market peaks.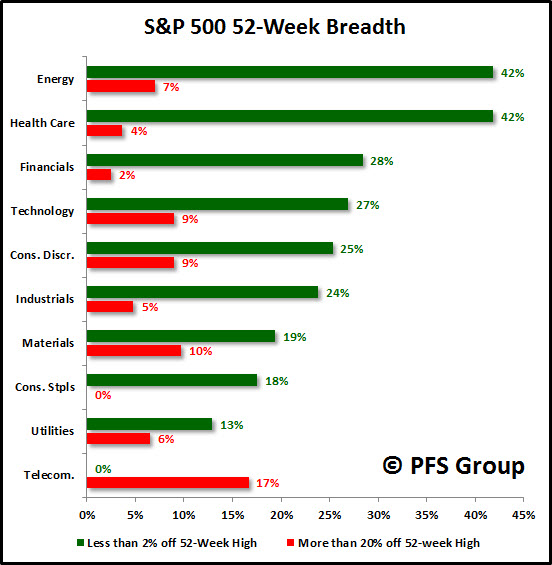
Market Indicator Summary
Below is a multi-indicator chart of the S&P 500 that measures breadth and momentum. The second and third panel show the market has yet to reach overbought territory and may continue to rally into the coming week before taking a pause. As shown in the fourth panel, sentiment levels have not reached bullish extremes and suggests the market can continue to rally before running into trouble.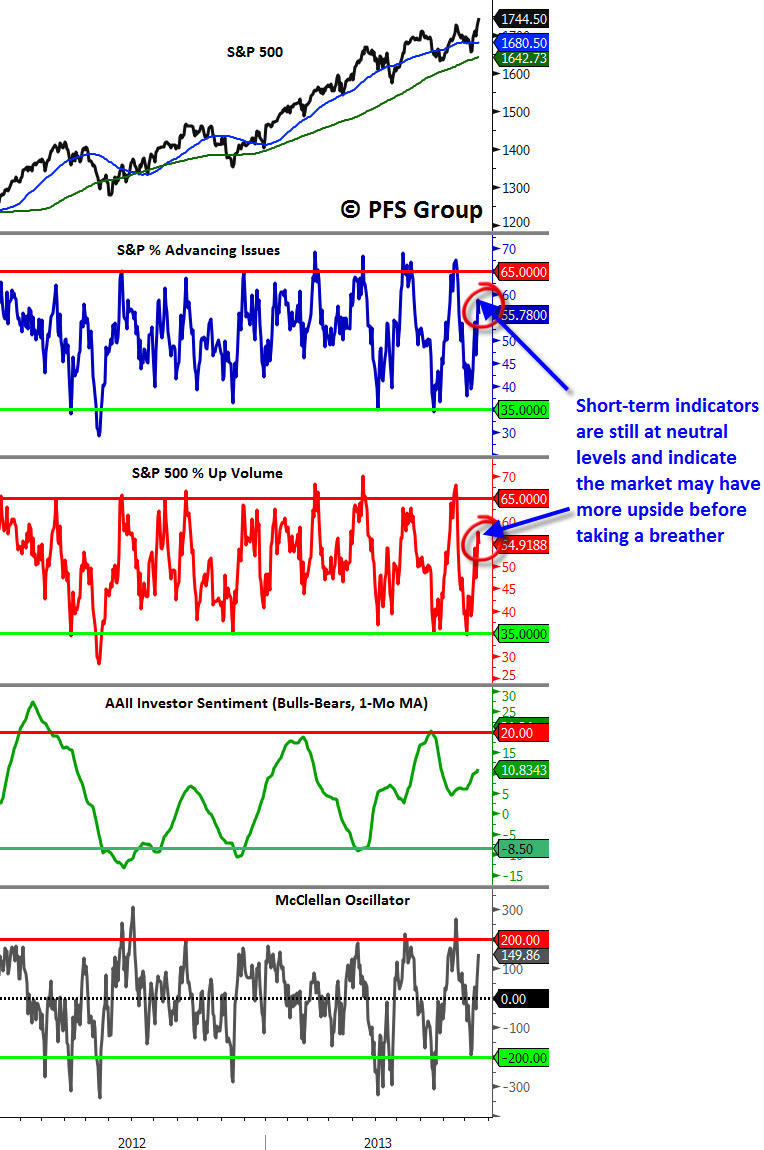
Summary
The market’s long and intermediate-term trends have strengthened this week with momentum on nearly every time frame showing a buy signal expect for the weekly MACD, which is only a stone’s throw away at this point. Currently, leadership in the markets rests with economically-sensitive sectors while the defensive sectors are performing the worst, not something that we see near major market peaks. This suggests the economy remains on firm footing as does the bull market which continues to hit new all-time highs.
- English (UK)
- English (India)
- English (Canada)
- English (Australia)
- English (South Africa)
- English (Philippines)
- English (Nigeria)
- Deutsch
- Español (España)
- Español (México)
- Français
- Italiano
- Nederlands
- Português (Portugal)
- Polski
- Português (Brasil)
- Русский
- Türkçe
- العربية
- Ελληνικά
- Svenska
- Suomi
- עברית
- 日本語
- 한국어
- 简体中文
- 繁體中文
- Bahasa Indonesia
- Bahasa Melayu
- ไทย
- Tiếng Việt
- हिंदी
Trend, Momentum Strengthen As Stocks Hit All-Time Highs
Published 10/20/2013, 12:27 AM
Updated 12/08/2023, 05:55 AM
Trend, Momentum Strengthen As Stocks Hit All-Time Highs
Latest comments
Loading next article…
Install Our App
Risk Disclosure: Trading in financial instruments and/or cryptocurrencies involves high risks including the risk of losing some, or all, of your investment amount, and may not be suitable for all investors. Prices of cryptocurrencies are extremely volatile and may be affected by external factors such as financial, regulatory or political events. Trading on margin increases the financial risks.
Before deciding to trade in financial instrument or cryptocurrencies you should be fully informed of the risks and costs associated with trading the financial markets, carefully consider your investment objectives, level of experience, and risk appetite, and seek professional advice where needed.
Fusion Media would like to remind you that the data contained in this website is not necessarily real-time nor accurate. The data and prices on the website are not necessarily provided by any market or exchange, but may be provided by market makers, and so prices may not be accurate and may differ from the actual price at any given market, meaning prices are indicative and not appropriate for trading purposes. Fusion Media and any provider of the data contained in this website will not accept liability for any loss or damage as a result of your trading, or your reliance on the information contained within this website.
It is prohibited to use, store, reproduce, display, modify, transmit or distribute the data contained in this website without the explicit prior written permission of Fusion Media and/or the data provider. All intellectual property rights are reserved by the providers and/or the exchange providing the data contained in this website.
Fusion Media may be compensated by the advertisers that appear on the website, based on your interaction with the advertisements or advertisers.
© 2007-2025 - Fusion Media Limited. All Rights Reserved.