: I've updated the charts below through Friday's close (July 5th). The yield on the 10-year note closed Friday at 2.73%, up from its 1.66% interim closing low on May 2nd. The rise of 107 bps in 44 market sessions is nowhere near the all-time record, which was 327 bps in February 1980. However that was when rates were in the 13% plus range. The latest surge, expressed as a percent (2.73 divided by 1.66 minus 1), is a 64% increase in 44 sessions -- historically unprecedented over an equivalent timeframe. Note: That 327 bps rise in 1980 was a 32% increase, half of what we've seen of late.
The latest Freddie Mac Weekly Primary Mortgage Market Survey, published July 3rd, puts the 30-year fixed at 4.29%, off its interim high of 4.46% set the previous week (the highest since August of 2011).
Here is a snapshot of the 10-year yield and the 30-year fixed mortgage since 2008.
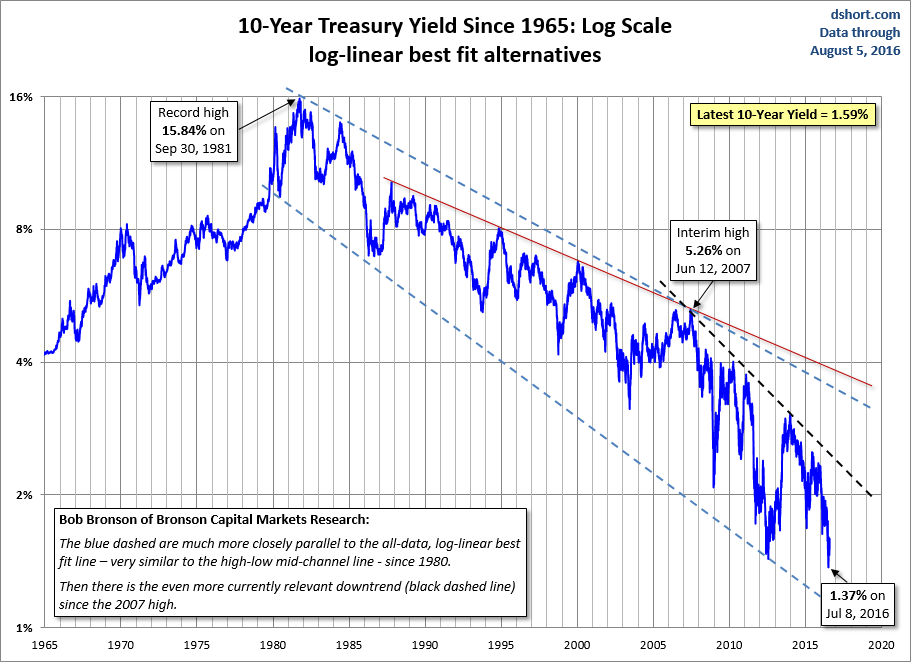
A log-scale snapshot of the 10-year yield offers a more accurate view of the relative change over time. Here is a long look since 1965, starting well before the 1973 Oil Embargo that triggered the era of "stagflation" (economic stagnation with inflation). I've drawn a trendline connecting the interim highs following those stagflationary years. The red line starts with the 1987 closing high on the Friday before the notorious Black Monday market crash. The S&P 500 fell 5.16% that Friday and 20.47% on Black Monday.
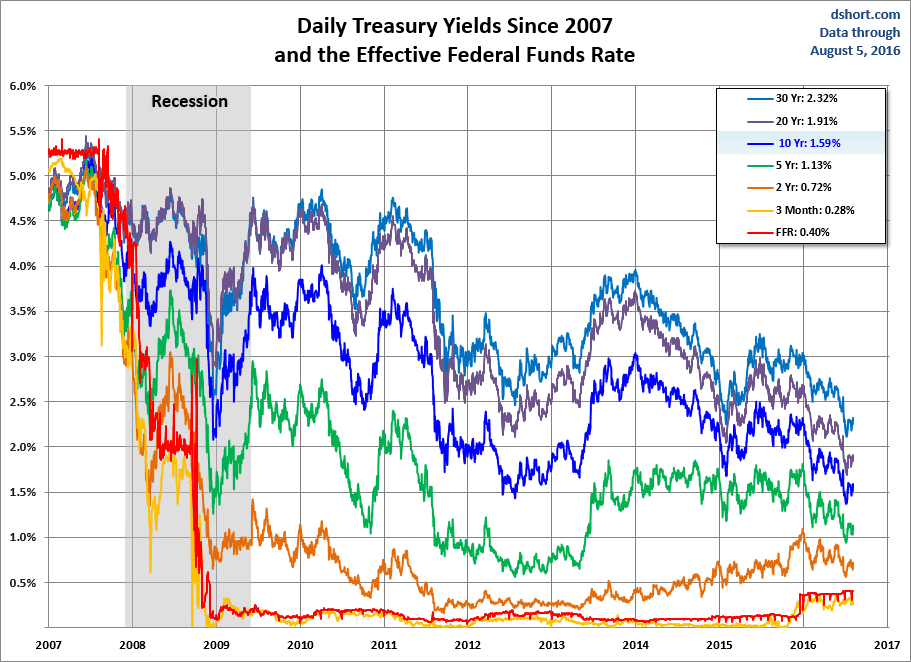
A Perspective on Yields Since 2007
The first chart shows the daily performance of several Treasuries and the Fed Funds Rate (FFR) since 2007. The source for the yields is the Daily Treasury Yield Curve Rates from the US Department of the Treasury and the New York Fed's website for the FFR.
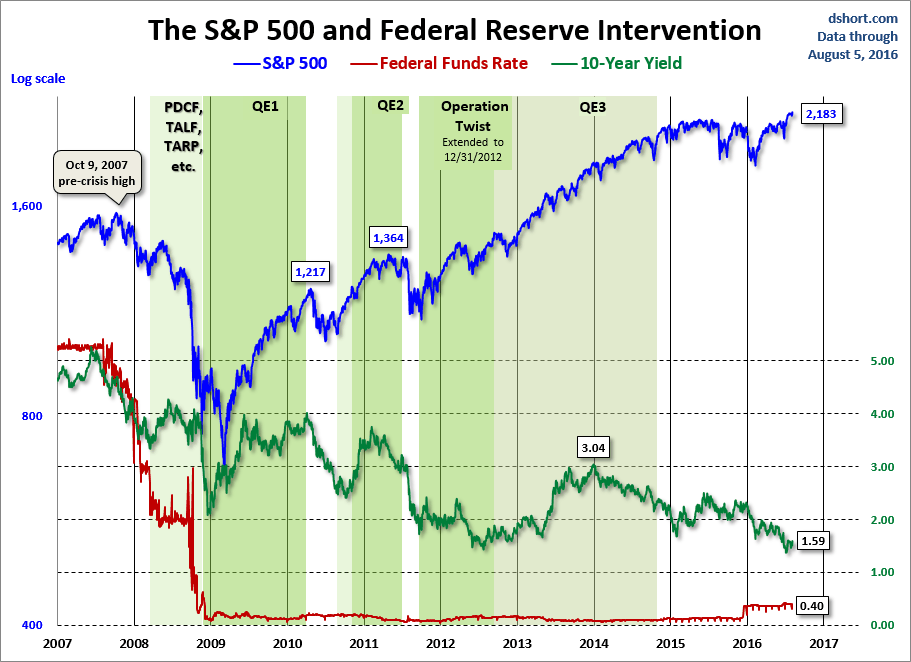
Now let's see the 10-year against the S&P 500 with some notes on Federal Reserve intervention. Fed policy has been a major influence on market behavior. It will be interesting to see how the index fares in as Q2 earnings season opens and the market potentially reassesses its dependency on Fed easing that might be nearing an inflection point.
For a long-term view of weekly Treasury yields, also focusing on the 10-year, see my Treasury Yields in Perspective, which I update on weekends.
- English (UK)
- English (India)
- English (Canada)
- English (Australia)
- English (South Africa)
- English (Philippines)
- English (Nigeria)
- Deutsch
- Español (España)
- Español (México)
- Français
- Italiano
- Nederlands
- Português (Portugal)
- Polski
- Português (Brasil)
- Русский
- Türkçe
- العربية
- Ελληνικά
- Svenska
- Suomi
- עברית
- 日本語
- 한국어
- 简体中文
- 繁體中文
- Bahasa Indonesia
- Bahasa Melayu
- ไทย
- Tiếng Việt
- हिंदी
Treasury Snapshot: 10-Year Yield Increases At Record Pace
Published 07/08/2013, 12:30 AM
Updated 07/09/2023, 06:31 AM
Treasury Snapshot: 10-Year Yield Increases At Record Pace
What's New
Latest comments
Loading next article…
Install Our App
Risk Disclosure: Trading in financial instruments and/or cryptocurrencies involves high risks including the risk of losing some, or all, of your investment amount, and may not be suitable for all investors. Prices of cryptocurrencies are extremely volatile and may be affected by external factors such as financial, regulatory or political events. Trading on margin increases the financial risks.
Before deciding to trade in financial instrument or cryptocurrencies you should be fully informed of the risks and costs associated with trading the financial markets, carefully consider your investment objectives, level of experience, and risk appetite, and seek professional advice where needed.
Fusion Media would like to remind you that the data contained in this website is not necessarily real-time nor accurate. The data and prices on the website are not necessarily provided by any market or exchange, but may be provided by market makers, and so prices may not be accurate and may differ from the actual price at any given market, meaning prices are indicative and not appropriate for trading purposes. Fusion Media and any provider of the data contained in this website will not accept liability for any loss or damage as a result of your trading, or your reliance on the information contained within this website.
It is prohibited to use, store, reproduce, display, modify, transmit or distribute the data contained in this website without the explicit prior written permission of Fusion Media and/or the data provider. All intellectual property rights are reserved by the providers and/or the exchange providing the data contained in this website.
Fusion Media may be compensated by the advertisers that appear on the website, based on your interaction with the advertisements or advertisers.
© 2007-2025 - Fusion Media Limited. All Rights Reserved.
