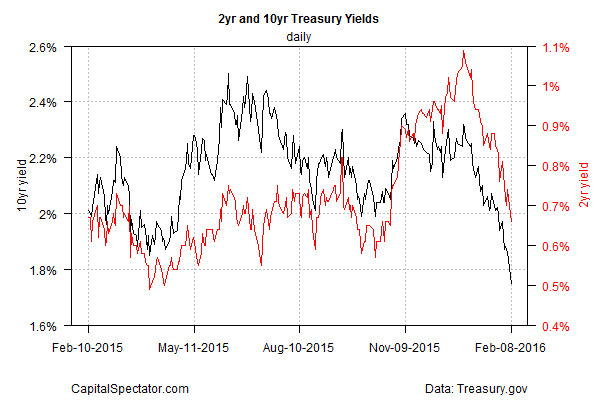
Yesterday’s tumble in US equities fueled another leg down in Treasury yields. As the bear market in stocks rolls on, the crowd continued to rush into the safe-haven trade, pushing the 10-year yield down to 1.75% yesterday (Feb. 8)–the lowest level in about a year, based on daily data via Treasury.gov. Meanwhile, the 2-year yield—considered the most sensitive spot on the yield curve for rate expectations—tumbled to 0.66%, the lowest in nearly four months.
The acceleration in the risk-off sentiment is raising more doubts about the Federal Reserve’s previously stated plans to continue raising interest rates this year. Not surprisingly, Fed funds futures are now assigning a near zero probability for a rate hike at next month’s FOMC meeting, based on CME data as of yesterday.

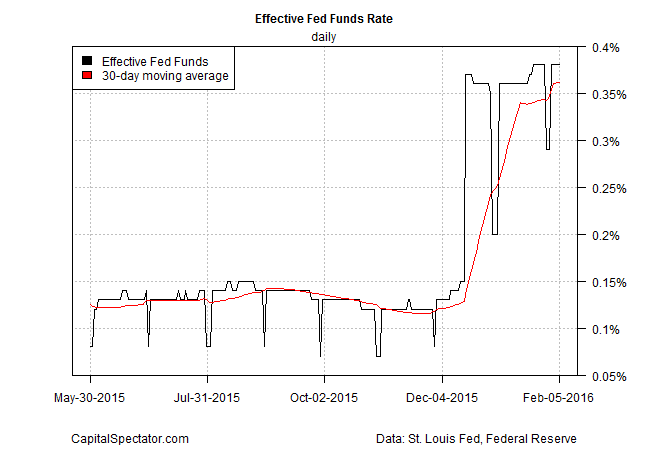
For the moment, the latest effective Fed funds rate (EFF) shows no sign of capitulation. EFF’s 30-day moving average was at a relatively elevated 0.36% as of Feb 5. Given the ongoing risk-off bias in markets, the crowd will be monitoring this rate for any signs of downside weakness. According to some analysts, the Fed will likely be forced to delay rate hikes in the months ahead and perhaps even reverse the mild 25-basis-point hike in December, which marked the first increase in Fed funds since 2006. There are also more calls for the nuclear option for US monetary policy: negative rates.

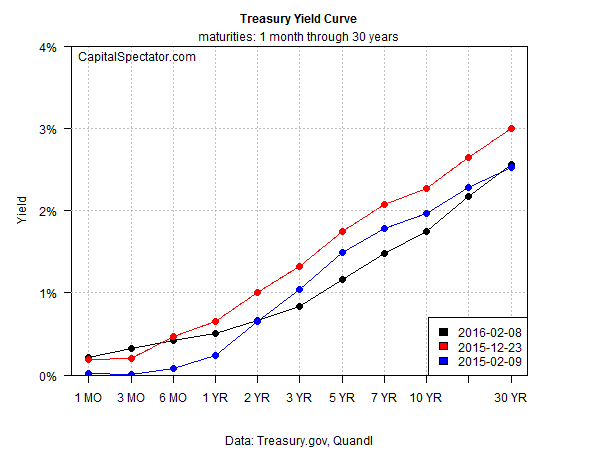
Meantime, the Treasury yield curve remains positively sloped, but the upward bias has eased lately—particularly on the short end. The curve for maturities from one month through three years is nearly flat at the moment (black line in chart below) vs. the curve from 30 trading days previous (red line).

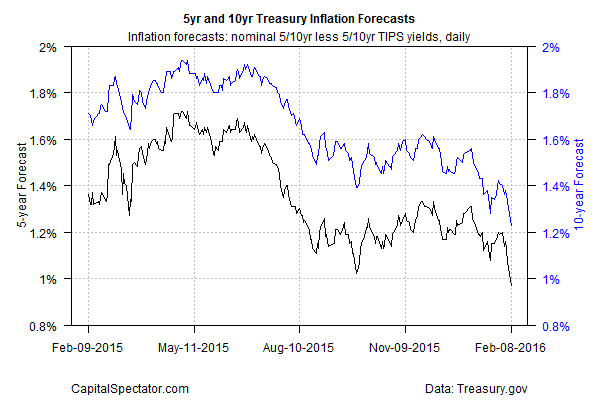
In another worrisome development, inflation expectations are plunging. The yield spread for the nominal 10-year Treasury less its inflation-indexed counterpart, for instance, tumbled to 1.23% yesterday–the lowest since the spring of 2009, when the Great Recession was stalking the macro landscape.

“It’s hard to find a reason to short Treasuries,” Tomohisa Fujiki, head of interest-rate strategy for BNP Paribas in Tokyo, tells Bloomberg.
The antidote for the gloom is firmer economic data, of course. On that front, key releases to watch include Thursday’s weekly jobless claims update and the main event this week for US macro: retail sales, scheduled for Friday (Feb. 12). At the moment, the crowd’s looking for a respectable rise in consumer spending. Econoday.com’s consensus forecast calls for a 0.2% increase in sales for January. If the prediction holds, the numbers may provide some sentiment relief.
On another upbeat note in the dark art of looking forward, the widely followed GDPNow model via the Atlanta Fed is currently projecting (as of Feb. 5) a solid rebound in US economic growth in this year’s first quarter after last year’s stall speed data: +2.2% vs. +0.7% in 2015’s final three months (seasonally adjusted annual rate). But for the moment, the markets aren’t buying the rebound narrative and nothing less than hard data (as opposed to optimistic forecasts) will likely change the crowd’s expectations.
