I wrote that comment Monday evening and stand by it even with the rally in Treasuries Tuesday. The Euphoria in Treasury Bonds (TLT) seems almost giddy given the the many macro and micro indicators to that should raise caution. There has been net selling of bonds for some time now and whether you believe that the money is going into stocks or sitting in cash does not matter. If it leaves bonds it leaves bonds. There is also this little thing that has been referred to as the Fed Taper, where they will (notice I did not say might) cut stimulus, by reducing bond purchases, in the near future. The only question is when. Before we get to the price charts take a look at the bullish Sentiment from StockTwits.
76% bullish is quite high if I remember how far that is from 100 correctly. But enough of the snark. If you are buying Treasury Bonds for an oversold bounce then have at it, more power too you. But the Long term picture is far from clear and reminds me of the last half of 2012 into the beginning of 2013 when there was a giddy buying attitude in coal stocks as well. The chart of the Coal ETF (KOL) below shows the potential bottoming after a 50% fall from the high at the beginning of 2011.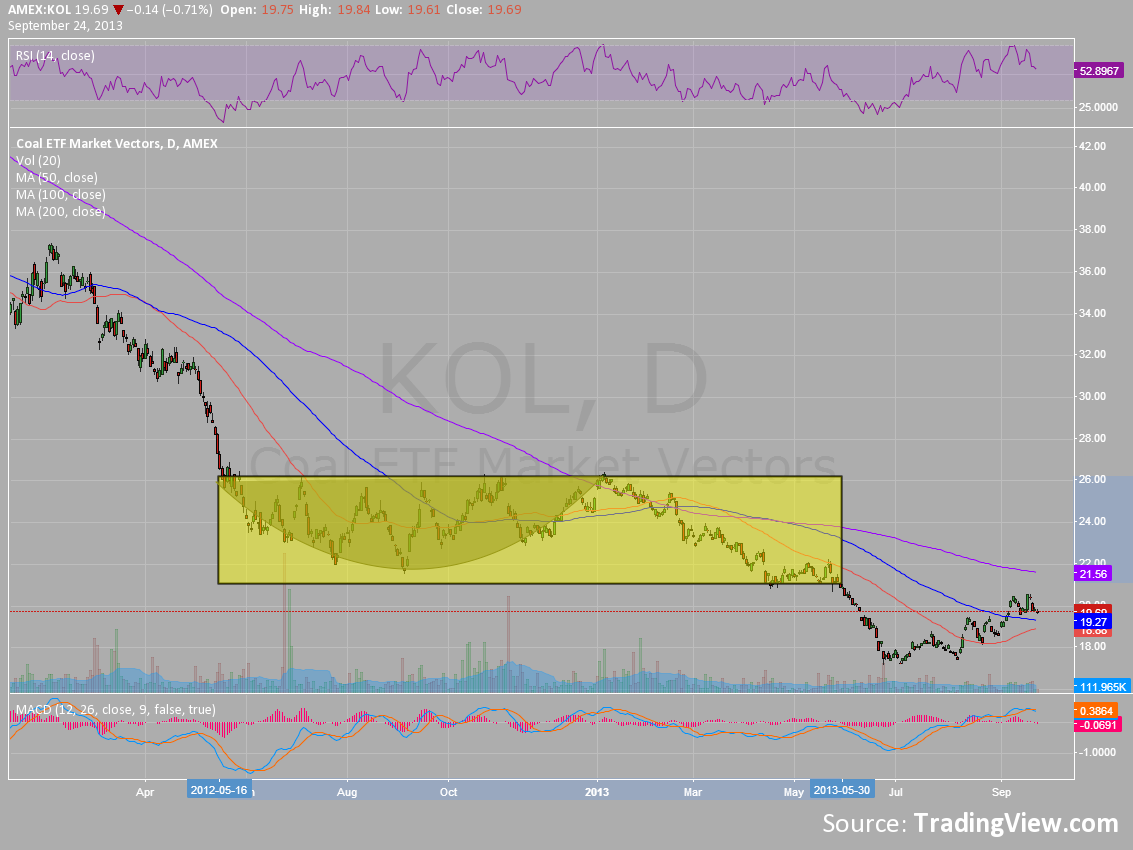
Every time that the price tried to rise from a relative low buyers were trying to pick the bottom and ride to new highs a hero, only to get stopped out. The rounding bottom got even more traders to cheat on an entry before the break out. The problem was that Coal was consolidating, not rising. Traders had mistaken a lack of continued downside with certainty of a reversal higher. But there is a third state in the market. A sideways motion. This is why so many technicians urge that you do not enter a trade until the trigger to do so confirms it. In this case, a break of the yellow box higher would have signaled a buy, not a turn off of the low. As it turns out this name ended up breaking the box eventually, but to the downside.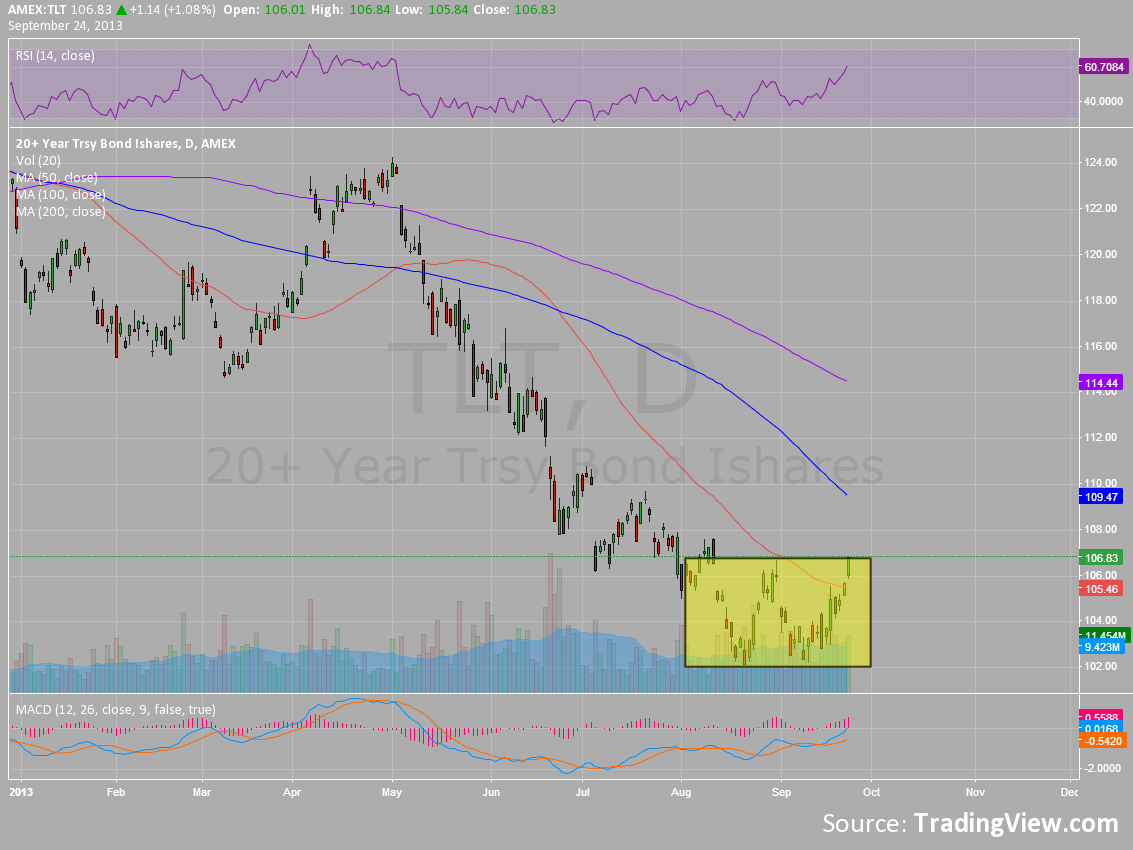
Now look at the Treasury Bond ETF, TLT. This has also been in a downtrend for a few months. And that downtrend appears to have stopped. It is consolidating in its own yellow box. It may break out of it to the upside but has not yet. Many are noticing a double bottom, and that could turn out to hold up. The momentum indicators are also supportive of a move higher, but they were in KOL as well. If it can move above 108 then maybe it is different this time. But until it does this chart should give caution as it could just as easily turn into a bear flag and continue lower to the Measured Move of 84.
Disclosure: I am short TLT stock in client accounts but hedged with January Call options.
The information in this blog post represents my own opinions and does not contain a recommendation for any particular security or investment. I or my affiliates may hold positions or other interests in securities mentioned in the Blog, please see my Disclaimer page for my full disclaimer.
Original post
- English (UK)
- English (India)
- English (Canada)
- English (Australia)
- English (South Africa)
- English (Philippines)
- English (Nigeria)
- Deutsch
- Español (España)
- Español (México)
- Français
- Italiano
- Nederlands
- Português (Portugal)
- Polski
- Português (Brasil)
- Русский
- Türkçe
- العربية
- Ελληνικά
- Svenska
- Suomi
- עברית
- 日本語
- 한국어
- 简体中文
- 繁體中文
- Bahasa Indonesia
- Bahasa Melayu
- ไทย
- Tiếng Việt
- हिंदी
Treasury Bonds Remind Me Of Coal
Published 09/25/2013, 08:19 AM
Updated 05/14/2017, 06:45 AM
Treasury Bonds Remind Me Of Coal
Latest comments
Loading next article…
Install Our App
Risk Disclosure: Trading in financial instruments and/or cryptocurrencies involves high risks including the risk of losing some, or all, of your investment amount, and may not be suitable for all investors. Prices of cryptocurrencies are extremely volatile and may be affected by external factors such as financial, regulatory or political events. Trading on margin increases the financial risks.
Before deciding to trade in financial instrument or cryptocurrencies you should be fully informed of the risks and costs associated with trading the financial markets, carefully consider your investment objectives, level of experience, and risk appetite, and seek professional advice where needed.
Fusion Media would like to remind you that the data contained in this website is not necessarily real-time nor accurate. The data and prices on the website are not necessarily provided by any market or exchange, but may be provided by market makers, and so prices may not be accurate and may differ from the actual price at any given market, meaning prices are indicative and not appropriate for trading purposes. Fusion Media and any provider of the data contained in this website will not accept liability for any loss or damage as a result of your trading, or your reliance on the information contained within this website.
It is prohibited to use, store, reproduce, display, modify, transmit or distribute the data contained in this website without the explicit prior written permission of Fusion Media and/or the data provider. All intellectual property rights are reserved by the providers and/or the exchange providing the data contained in this website.
Fusion Media may be compensated by the advertisers that appear on the website, based on your interaction with the advertisements or advertisers.
© 2007-2025 - Fusion Media Limited. All Rights Reserved.