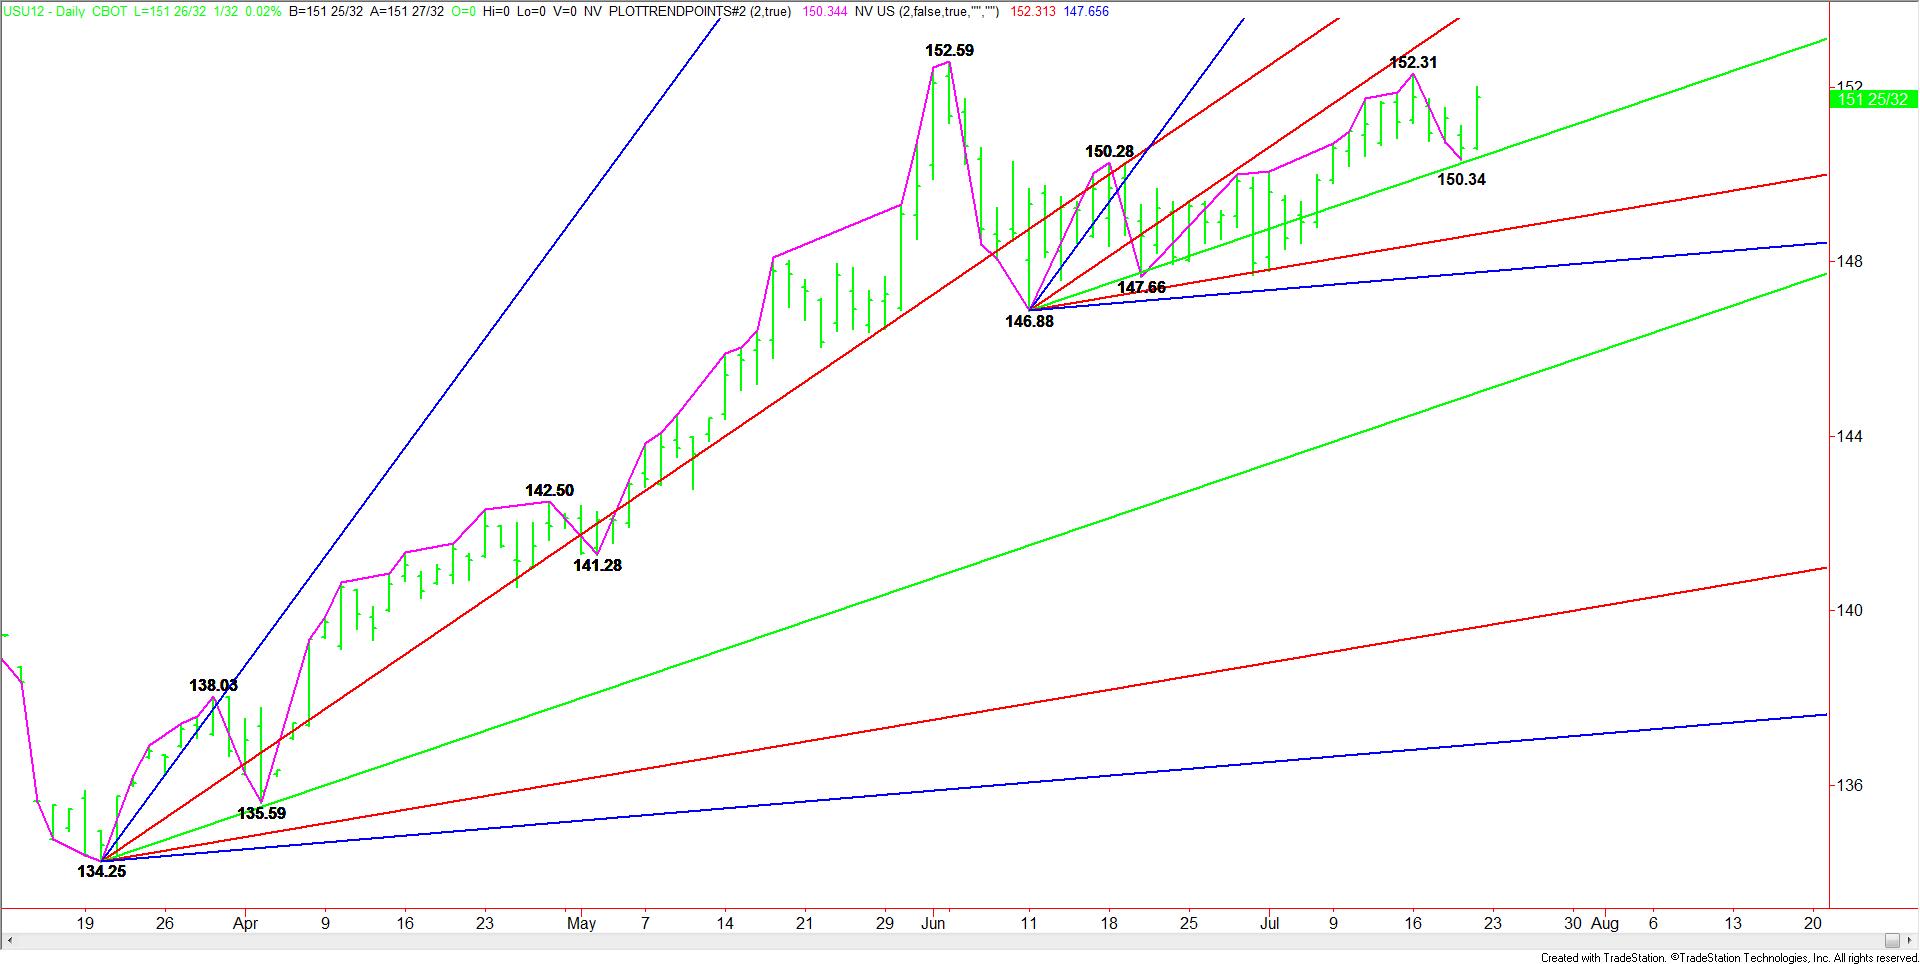
After a three-day sell-off, September Treasury Bond futures rallied sharply higher on Friday, putting the market in a position to challenge two former tops at 152’10 and 152’19. The turnaround in the market also formed a new minor or one-day bottom at 150’11.
After reaching a high at 152’10 on July 16, Treasury Bonds sold off on speculation that the U.S. Federal Reserve would provide more stimulus to boost the economy. The last lower drive to 150’11 on July 19 was triggered by weak manufacturing and unemployment claims.
Based on testimony in Washington earlier in the week from Fed Chairman Ben Bernanke, the central bank stands ready to act if the economy continues to show signs of weakness. One of his primary concerns is the employment data. The next U.S. Non-Farm Payrolls report is due out on Friday, August 3. This report could set the tone for the Federal Open Market Committee to take action on the economy.
Last week’s break was a sign that Treasury Bonds are likely to fall when the Fed decides to act, but Friday’s quick turnaround served as a warning that any signs of problems in the Euro Zone will send traders into the safety of the U.S. Dollar and Treasuries. No one is certain when the Fed will act, but the market is showing signs that it will act at some time in the near future.
Despite the recent volatility in the interest rate sector, one thing that has remained constant is the series of higher-tops and higher-bottoms. Since bottoming at 146’28 on June 11, the September Treasury Bond futures contract has produced minor swing bottoms at 147’23 and 150’11. Because of this, the bias remains to the upside. Traders have been tentative to buy strength, however, which is why we have not seen a new higher-high for almost two-months.

Technically, uptrending Gann angle support is at 150’16 on Monday. This angle has been providing support and direction since mid-June and could serve as a key indicator that the market is setting up for a sell-off if it is penetrated.
The bigger picture suggests that the market could be forming a double-top, but this conventional chart pattern will not be confirmed until the main bottom at 146’28 is broken. A move through this level will suggest that the bigger picture is making a dramatic shift, but it looks as if it will take some time for this chart pattern to confirm.
Until there is a serious indication of a change in trend to the downside, the September Treasury Bonds could trade sideways-to-higher. The longer it spends inside of the 152’19 to 146’28 range, the more it looks like a distributive topping pattern.
After reaching a high at 152’10 on July 16, Treasury Bonds sold off on speculation that the U.S. Federal Reserve would provide more stimulus to boost the economy. The last lower drive to 150’11 on July 19 was triggered by weak manufacturing and unemployment claims.
Based on testimony in Washington earlier in the week from Fed Chairman Ben Bernanke, the central bank stands ready to act if the economy continues to show signs of weakness. One of his primary concerns is the employment data. The next U.S. Non-Farm Payrolls report is due out on Friday, August 3. This report could set the tone for the Federal Open Market Committee to take action on the economy.
Last week’s break was a sign that Treasury Bonds are likely to fall when the Fed decides to act, but Friday’s quick turnaround served as a warning that any signs of problems in the Euro Zone will send traders into the safety of the U.S. Dollar and Treasuries. No one is certain when the Fed will act, but the market is showing signs that it will act at some time in the near future.
Despite the recent volatility in the interest rate sector, one thing that has remained constant is the series of higher-tops and higher-bottoms. Since bottoming at 146’28 on June 11, the September Treasury Bond futures contract has produced minor swing bottoms at 147’23 and 150’11. Because of this, the bias remains to the upside. Traders have been tentative to buy strength, however, which is why we have not seen a new higher-high for almost two-months.

Technically, uptrending Gann angle support is at 150’16 on Monday. This angle has been providing support and direction since mid-June and could serve as a key indicator that the market is setting up for a sell-off if it is penetrated.
The bigger picture suggests that the market could be forming a double-top, but this conventional chart pattern will not be confirmed until the main bottom at 146’28 is broken. A move through this level will suggest that the bigger picture is making a dramatic shift, but it looks as if it will take some time for this chart pattern to confirm.
Until there is a serious indication of a change in trend to the downside, the September Treasury Bonds could trade sideways-to-higher. The longer it spends inside of the 152’19 to 146’28 range, the more it looks like a distributive topping pattern.
