Final top in T-Bond futures should be in the 155-00 to 160-00 area.
I believe that the T-Bond market (basis the futures) is in the final blow-off of a bull trend that began in the early 1980s. This current advance should accelerate to the mid- to high- 150s before the final top in prices (low in rates) occurs.
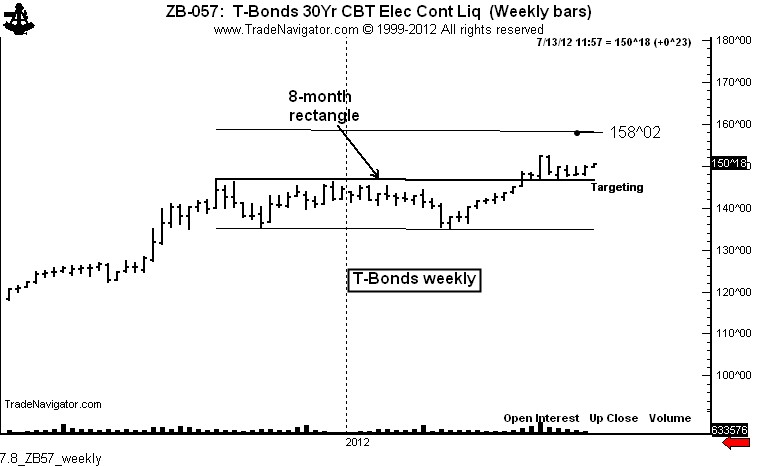
The advance in mid May completed an 8-month rectangle on the weekly and daily continuation charts (daily chart shown below). This pattern has an unmet target of 158-00 to 158-16. Following the mid May breakout, the advance in the market stalled and the upper boundary of the rectangle was retested in mid June.
The daily contract of the Sept. futures shows this retest in close up. Note that the retest has taken the form of a 5-week symmetrical triangle. The advance on Monday penetrated the upper boundary of this small pattern, thus confirming that the retesting process is complete. The target in the Sept. contract is 155-00 to 156-00.
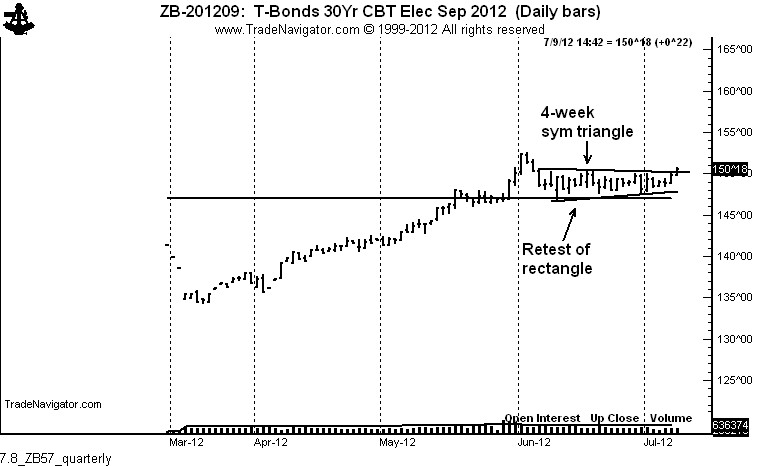
I went long the Sept. contract yesterday. My risk is a close below yesterday’s low at 149-26. A close below 149-26 would negate my short-term analysis.
While I am long for a swing trade, my extended-term macro view of the market is that this current advance is the final leg of an historic bull trend — and that when completed, Bonds (and all other global interest rate futures) will become the short play of a lifetime.
The chart below shows the 10-year T-Bond yield since the late 1790s.
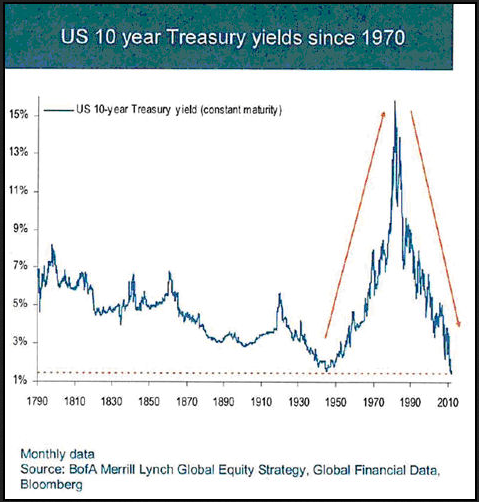
Interest rates are at an all-time low level in yield. Remember, Bond prices and yields trade inversely — when yields go down, prices go up. A bottom in the yield is the same as a top in price. The fiscal and monetary policies that are manipulating this ZIRP are also sowing the seeds of higher interests (lower prices) down the road.
While some more astute readers may disagree, I do NOT believe interest rates (at any duration on the yield curve) will go below zero. Such a development would put tremendous downward pressure on the U.S. dollar — which in turn would force the hand of debtor countries such as China and Japan. Eventually market forces will overpower the attempt by the three stooges (“Little Timmy” Geithner, Obama and “”Uncle Benny” Bernanke) to keep interest rates near zero.
The U.S. government’s Zero Interest Rate Policy (ZIRP) will not go on forever. The forces of market discipline will not be kind in the end. Geithner and Bernanke will not be viewed with favor by history.
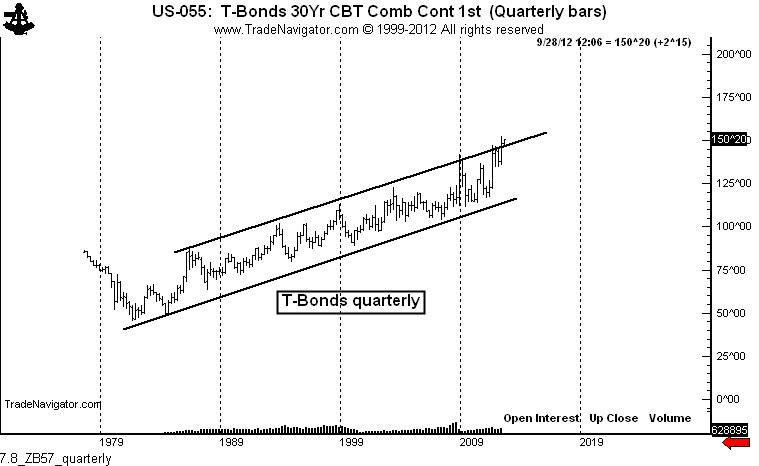
The chart below shows the quarterly bar chart of Bond futures. The market is presently “overshooting” the upper boundary of a channel. This is price behavior consistent with a blow off.
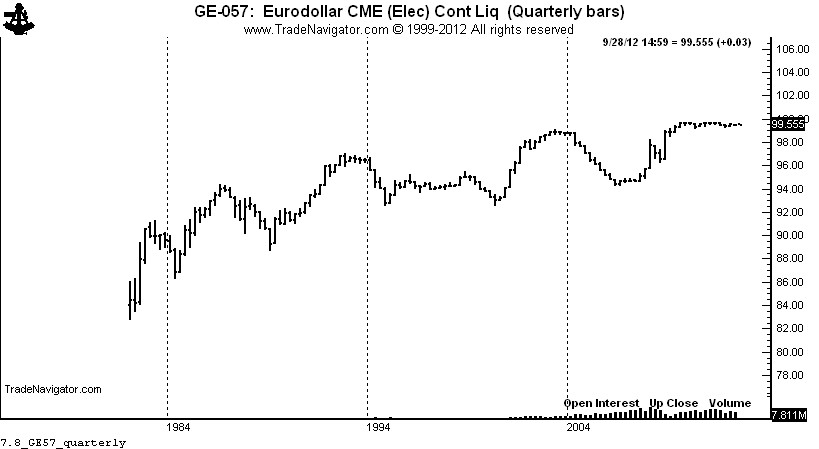
The final chart is the quarterly graph of the Eurodollar (interest rate, not forex pair). Over its history, the euro contract at the IMM has had the largest volume of ALL futures contracts. A volume in excess of three million contracts per day is not unusual.
The euro will NOT close above par 100. I know some of you disagree. But it will NOT happen. There is no upside potential — only downside risk — in euros.
In summary, I am presently long Bonds for a swing trade because I believe the market is driving to the final high. Where ever this high is, it is likely to be a high for 50 or more years.
I believe that the T-Bond market (basis the futures) is in the final blow-off of a bull trend that began in the early 1980s. This current advance should accelerate to the mid- to high- 150s before the final top in prices (low in rates) occurs.
The advance in mid May completed an 8-month rectangle on the weekly and daily continuation charts (daily chart shown below). This pattern has an unmet target of 158-00 to 158-16. Following the mid May breakout, the advance in the market stalled and the upper boundary of the rectangle was retested in mid June.

The daily contract of the Sept. futures shows this retest in close up. Note that the retest has taken the form of a 5-week symmetrical triangle. The advance on Monday penetrated the upper boundary of this small pattern, thus confirming that the retesting process is complete. The target in the Sept. contract is 155-00 to 156-00.

I went long the Sept. contract yesterday. My risk is a close below yesterday’s low at 149-26. A close below 149-26 would negate my short-term analysis.
While I am long for a swing trade, my extended-term macro view of the market is that this current advance is the final leg of an historic bull trend — and that when completed, Bonds (and all other global interest rate futures) will become the short play of a lifetime.
The chart below shows the 10-year T-Bond yield since the late 1790s.

Interest rates are at an all-time low level in yield. Remember, Bond prices and yields trade inversely — when yields go down, prices go up. A bottom in the yield is the same as a top in price. The fiscal and monetary policies that are manipulating this ZIRP are also sowing the seeds of higher interests (lower prices) down the road.
While some more astute readers may disagree, I do NOT believe interest rates (at any duration on the yield curve) will go below zero. Such a development would put tremendous downward pressure on the U.S. dollar — which in turn would force the hand of debtor countries such as China and Japan. Eventually market forces will overpower the attempt by the three stooges (“Little Timmy” Geithner, Obama and “”Uncle Benny” Bernanke) to keep interest rates near zero.
The U.S. government’s Zero Interest Rate Policy (ZIRP) will not go on forever. The forces of market discipline will not be kind in the end. Geithner and Bernanke will not be viewed with favor by history.
The chart below shows the quarterly bar chart of Bond futures. The market is presently “overshooting” the upper boundary of a channel. This is price behavior consistent with a blow off.

The final chart is the quarterly graph of the Eurodollar (interest rate, not forex pair). Over its history, the euro contract at the IMM has had the largest volume of ALL futures contracts. A volume in excess of three million contracts per day is not unusual.
The euro will NOT close above par 100. I know some of you disagree. But it will NOT happen. There is no upside potential — only downside risk — in euros.

In summary, I am presently long Bonds for a swing trade because I believe the market is driving to the final high. Where ever this high is, it is likely to be a high for 50 or more years.
