Note from dshort: The selloff in equities has, of course, been accompanied by a rally in Treasuries, as the falling yields illustrate. The 10-year note closed today with at 1.92. That is 50 basis points below its interim high on October 27 and just three basis points above its interim low on November 23. The dramatic plunge to 1.72 in October remains the historic low.
The Federal Reserve officially announced Operation Twist on September 21 with the stated purpose of lowering longer-term interest rates. The yield on the 10-year note had been been below 2.00% 5 of the 9 days prior to the much-rumored announcement, closed at a new low of 1.88% on the day of the announcement and reached the historic closing low of 1.72 the next day, September 22.
What has the 10-year note done since the "Twist" announcement? The interim high daily close was 2.42 on October 27. The interim low was 1.89 at the November 23 close.
It's too soon, of course, to tell how successful the "Twist" strategy will be for lowering interest rates; the program is barely off the ground. According to the Freddie Mac survey, the 30-year mortgage rate has fluctuated between 3.94% and 4.18% since the first week in September, and the most recent average (as of November 23rd) is 3.98%. I will continue to watch Treasury yields and mortgage rates in the weeks ahead to see if Operation Twist lives up to the Fed's expectations.
Background Perspective on Yields
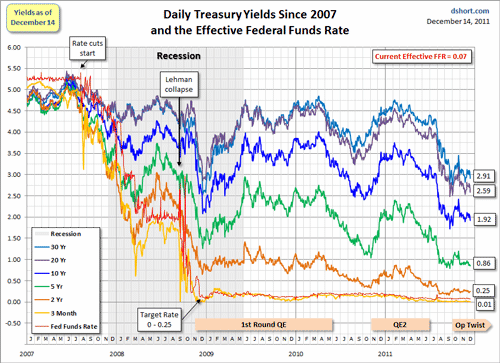
The first chart shows the daily performance of several Treasuries and the Fed Funds Rate (FFR) since 2007. The source for the yields is the Daily Treasury Yield Curve Rates from the US Department of the Treasury and the New York Fed's website for the FFR.
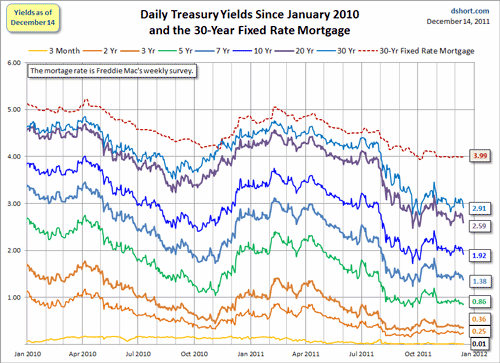
Here's a closer look at the past year with the 30-year fixed mortgage added to the mix (excluding points).
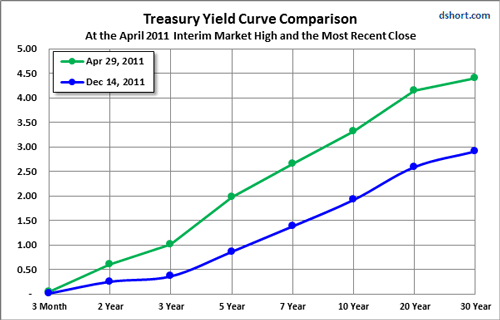
Here's a comparison of the yield curve at two points in time: 1) today's close and 2) the daily close on the market's interim high on April 29th. The S&P 500 is down nearly about 12.7% since then.
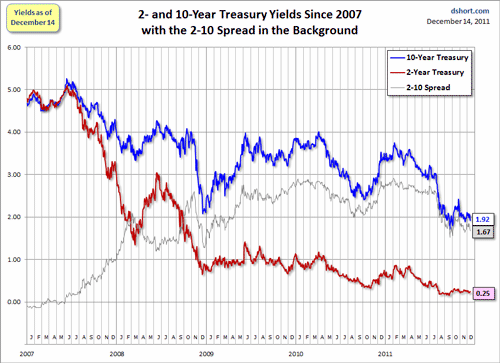
The next chart shows the 2- and 10-year yields with the 2-10 spread highlighted in the background.
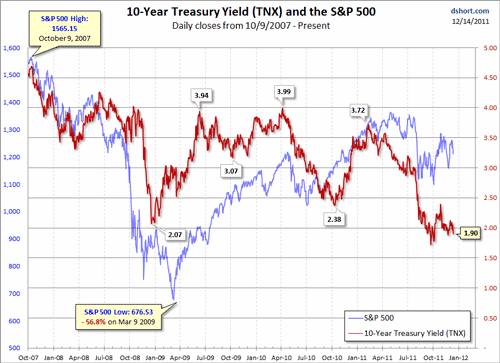
The final chart is an overlay of the CBOE Interest Rate 10-Year Treasury Note (TNX) and the S&P 500.
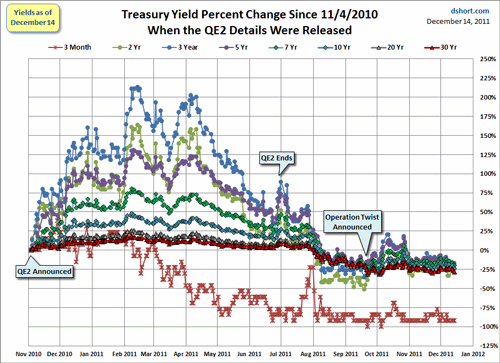
The final chart shows the percent change for a basket of eight Treasuries since the initiation of the second round of quantitative easing on November 4th, 2010.
The Federal Reserve officially announced Operation Twist on September 21 with the stated purpose of lowering longer-term interest rates. The yield on the 10-year note had been been below 2.00% 5 of the 9 days prior to the much-rumored announcement, closed at a new low of 1.88% on the day of the announcement and reached the historic closing low of 1.72 the next day, September 22.
What has the 10-year note done since the "Twist" announcement? The interim high daily close was 2.42 on October 27. The interim low was 1.89 at the November 23 close.
It's too soon, of course, to tell how successful the "Twist" strategy will be for lowering interest rates; the program is barely off the ground. According to the Freddie Mac survey, the 30-year mortgage rate has fluctuated between 3.94% and 4.18% since the first week in September, and the most recent average (as of November 23rd) is 3.98%. I will continue to watch Treasury yields and mortgage rates in the weeks ahead to see if Operation Twist lives up to the Fed's expectations.
Background Perspective on Yields
The first chart shows the daily performance of several Treasuries and the Fed Funds Rate (FFR) since 2007. The source for the yields is the Daily Treasury Yield Curve Rates from the US Department of the Treasury and the New York Fed's website for the FFR.

Here's a closer look at the past year with the 30-year fixed mortgage added to the mix (excluding points).

Here's a comparison of the yield curve at two points in time: 1) today's close and 2) the daily close on the market's interim high on April 29th. The S&P 500 is down nearly about 12.7% since then.

The next chart shows the 2- and 10-year yields with the 2-10 spread highlighted in the background.

The final chart is an overlay of the CBOE Interest Rate 10-Year Treasury Note (TNX) and the S&P 500.

The final chart shows the percent change for a basket of eight Treasuries since the initiation of the second round of quantitative easing on November 4th, 2010.

