This past weekend I noted what has been something strange lately. US Treasuries were moving higher as the US dollar was pulling back. It turns out that this is not so unusual.
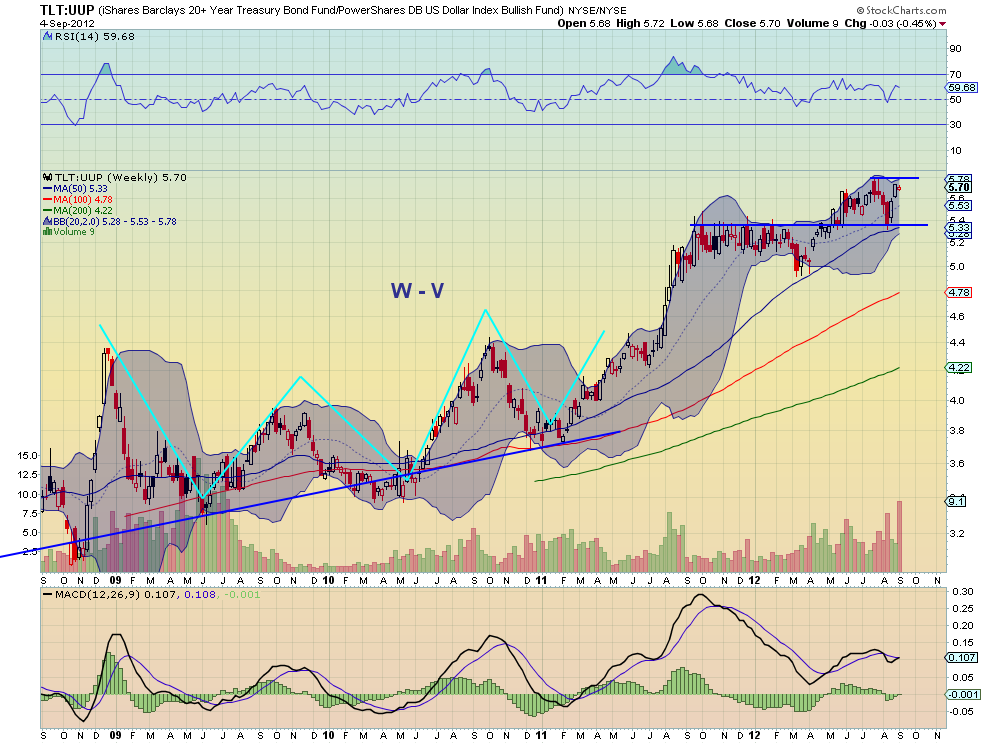
Digging deeper, the weekly ratio chart of the iShares Barclays 20+ Year Treasury Bond Fund (TLT) against the PowerShares DB US Dollar Index Bullish Fund (UUP) shows the period of strong correlation the last 12 months was preceded by a period of Treasury strength against the Dollar. This looks more like a long consolidation before another burst higher in relative strength. And it has the support of a rising and bullish Relative Strength Index (RSI) and a Moving Average Convergence Divergence indicator (MACD) that is about to cross to positive.
iShares Barclays 20+ Year Treasury Bond Fund,(TLT)/PowerShares DB US Dollar Index Bullish Fund (UUP) Weekly
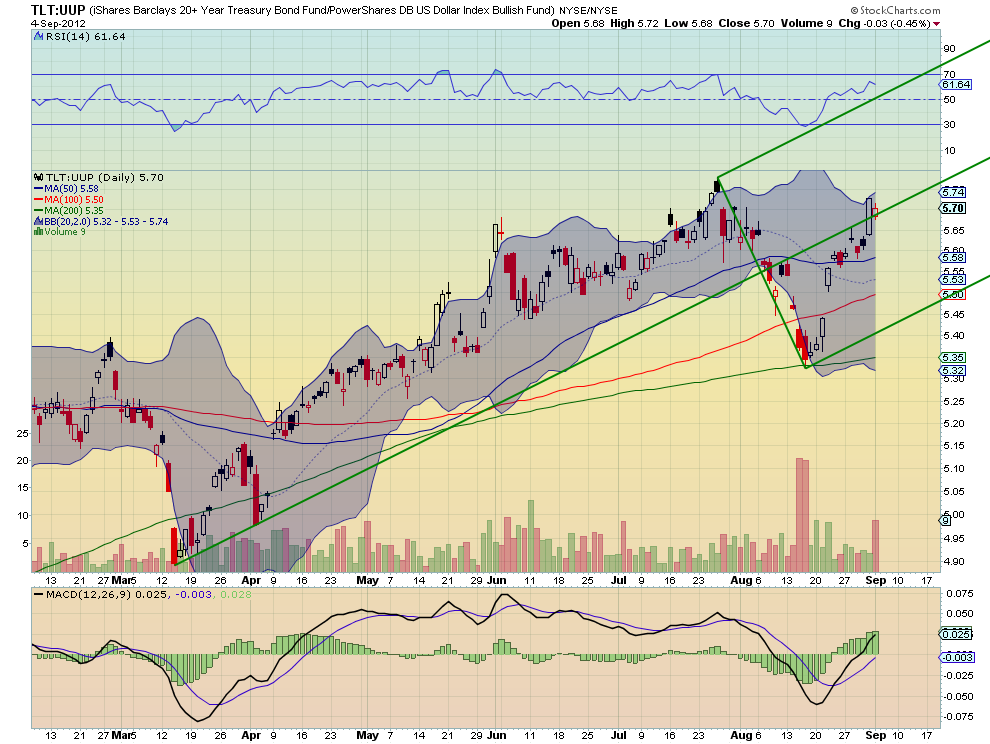
A bull flag in the run higher would give it a target of about 6.60 on the ratio or 15% higher. And a check of the daily chart of that ratio shows the trend higher is now riding along the Median Line of the Andrew’s Pitchfork, ready to start back higher.
Should it continue to ride higher along that Median Line the target at 6.60 would be reached in about 6 months time. Remember that the ratio can move higher by a rise in Treasuries, a fall in the dollar, both or just by both moving in the same direction but with one moving faster than the other. Look at the pair, not just the pieces.
iShares Barclays 20+ Year Treasury Bond Fund (TLT)/PowerShares DB US Dollar Index Bullish Fund (UUP) Daily
Disclaimer: The information in this blog post represents my own opinions and does not contain a recommendation for any particular security or investment. I or my affiliates may hold positions or other interests in securities mentioned in the Blog, please see my Disclaimer page for my full disclaimer.
Original post
- English (UK)
- English (India)
- English (Canada)
- English (Australia)
- English (South Africa)
- English (Philippines)
- English (Nigeria)
- Deutsch
- Español (España)
- Español (México)
- Français
- Italiano
- Nederlands
- Português (Portugal)
- Polski
- Português (Brasil)
- Русский
- Türkçe
- العربية
- Ελληνικά
- Svenska
- Suomi
- עברית
- 日本語
- 한국어
- 简体中文
- 繁體中文
- Bahasa Indonesia
- Bahasa Melayu
- ไทย
- Tiếng Việt
- हिंदी
Treasuries Look To Continue Divergence With The Dollar
Published 09/05/2012, 08:19 AM
Updated 05/14/2017, 06:45 AM
Treasuries Look To Continue Divergence With The Dollar
Latest comments
Loading next article…
Install Our App
Risk Disclosure: Trading in financial instruments and/or cryptocurrencies involves high risks including the risk of losing some, or all, of your investment amount, and may not be suitable for all investors. Prices of cryptocurrencies are extremely volatile and may be affected by external factors such as financial, regulatory or political events. Trading on margin increases the financial risks.
Before deciding to trade in financial instrument or cryptocurrencies you should be fully informed of the risks and costs associated with trading the financial markets, carefully consider your investment objectives, level of experience, and risk appetite, and seek professional advice where needed.
Fusion Media would like to remind you that the data contained in this website is not necessarily real-time nor accurate. The data and prices on the website are not necessarily provided by any market or exchange, but may be provided by market makers, and so prices may not be accurate and may differ from the actual price at any given market, meaning prices are indicative and not appropriate for trading purposes. Fusion Media and any provider of the data contained in this website will not accept liability for any loss or damage as a result of your trading, or your reliance on the information contained within this website.
It is prohibited to use, store, reproduce, display, modify, transmit or distribute the data contained in this website without the explicit prior written permission of Fusion Media and/or the data provider. All intellectual property rights are reserved by the providers and/or the exchange providing the data contained in this website.
Fusion Media may be compensated by the advertisers that appear on the website, based on your interaction with the advertisements or advertisers.
© 2007-2025 - Fusion Media Limited. All Rights Reserved.
