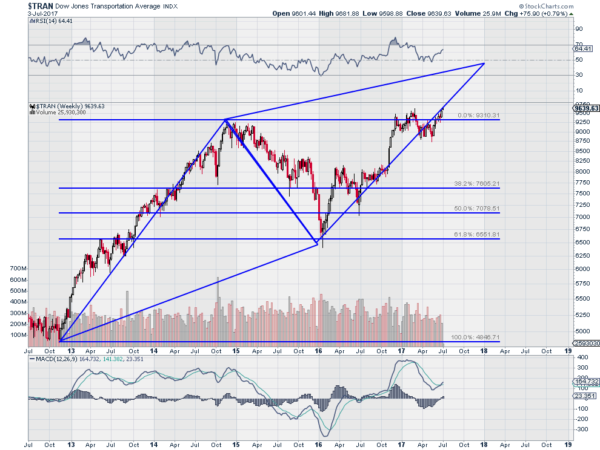
Last week the Dow Jones Transportation Index made an all-time high, surpassing the high made in February of 2017. For Dow Theorists this was big, as along with the new all-time high in the Dow Jones Industrials Average, this re-confirms the the primary trend higher in the markets. This means that both the Industrials and Transports are heading higher. That is good news for traders and investors.
But in the current, post financial crisis environment, new highs invariably has pundits discussing how this could be the top. Evidence suggests that new highs beget more new highs, but whatever. It is hard to debunk a group who constantly search for a piece of data to support their narrative. All I can do is take a look at the evidence and suggest where the path may lead. And there is a path in the Transports now that shows a shift into a higher gear.
The February 2017 high was retest of the prior high from late 2014. This came after a sell off that retraced 61.8% of the move that led to that high. With a struggle for a few months and now a break to a higher high, the Transports are shifting gears. The AB=CD pattern shown in the chart above gives a suggested path. It gives a target to 11060 at the end of the year. Time to ride higher.
The information in this blog post represents my own opinions and does not contain a recommendation for any particular security or investment. I or my affiliates may hold positions or other interests in securities mentioned in the Blog, please see my Disclaimer page for my full disclaimer.

