Investing.com’s stocks of the week
The Emini S&P 500 was up on Tuesday's daily chart in a Small Pullback Bull Trend, even while the weekly and monthly charts are in bull trends. Also, October often has a selloff that reverses up, while the rally can continue through the end of the year. The October 3 bear trap is a good candidate for the start of the year-end rally. This bullishness on the higher time frames increases the chance of bull trend days on the 5-minute chart.
Consider The Selloff
There have been 3 pullbacks on the daily chart since the October 3-bull trend reversal. Each one lasted only a day. Therefore, traders are aggressively buying brief selloffs. If there is one, watch for a midday reversal-up in the next day or so.
The bears want a lower high on the daily chart. There is a small wedge-top and therefore there is an increased chance of a several-day pullback. However, unless the bears get a Bear Surprise Bar on the daily chart, traders expect this rally to continue to get vacuumed up to the September all-time high.

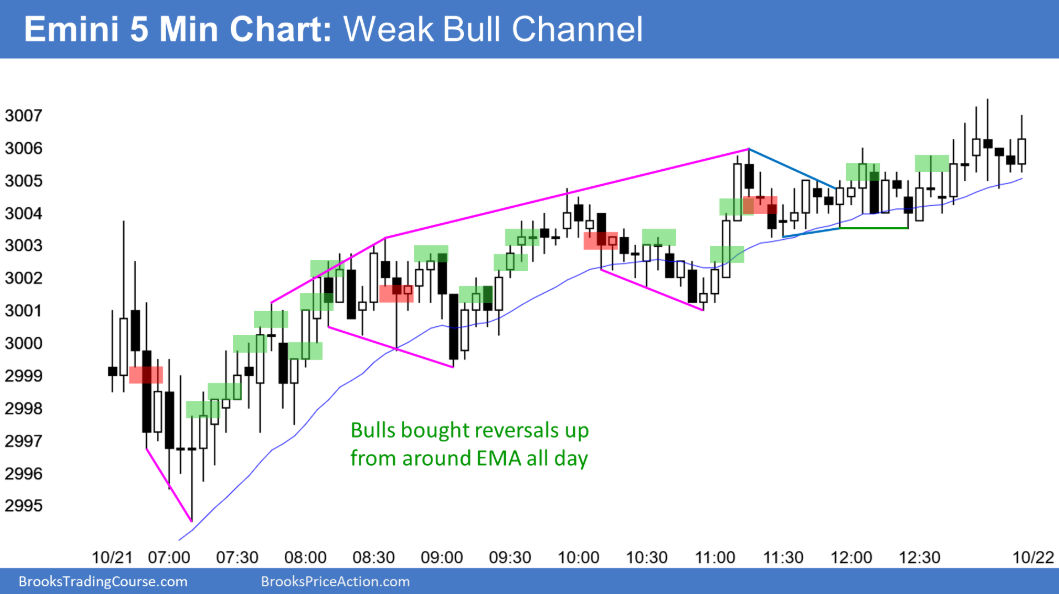
Here are several reasonable stop entry setups from yesterday. I show each buy entry with a green rectangle and each sell entry with a red rectangle.
