In this previous article a backtest showed that ranking the approximately 150 holdings of the iShares MSCI USA Min Volatility (NYSE:USMV), and selecting a portfolio of the 12 highest ranked stocks from them, provided much higher returns for the portfolio than for the underlying ETF and also SPY. To test these findings out-of-sample we launched the Best12(USMV)-Tradermodel on Jun-30-2014 and have since then published periodic trade signals, holdings and performance on our website. So far to December 8, 2014 the trading portfolio’s out-of-sample performance is 21.8%, while SPY gained 6%.
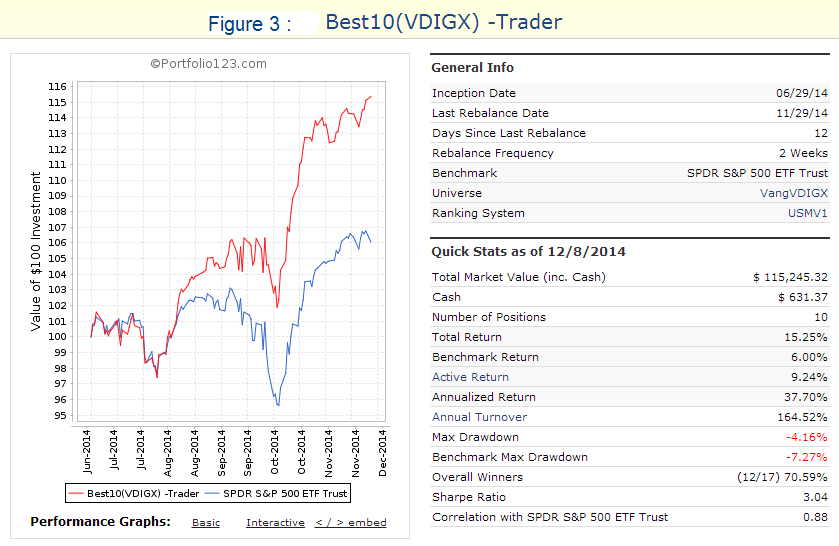
The above process has now been repeated using the holdings of the Vanguard Dividend Growth Fund. A simulation over the same time period (6/30/14 to 12/8/14) which selects periodically the 10 highest ranked stocks shows a 15.3% return while VDIGX gained 7.0%. This is shown in Figure-3 below.
According to Vanguard the Dividend Growth Fund “ focuses on high-quality companies that have both the ability and the commitment to grow their dividends over time and seeks above-average current income and long-term growth of capital and income. The advisor, Wellington Management Company, LLP, invests in a diversified array of stable, well-managed companies that have a history of or a potential for growing dividends over time. Valuation is key to security selection, with the advisor preferring stocks that trade at a discount to the market or that possess an attractive risk/reward profile.”
Backtesting Performance
VDIGX currently holds 49 large-cap stocks (market cap ranging from $10- to $393-billion) all of which were listed for at least five years. Using these stocks as the universe, backtests were performed on Portfolio 123, an online portfolio simulation platform, assuming an initial investment of $100,000.
Backtest period – 3 years.
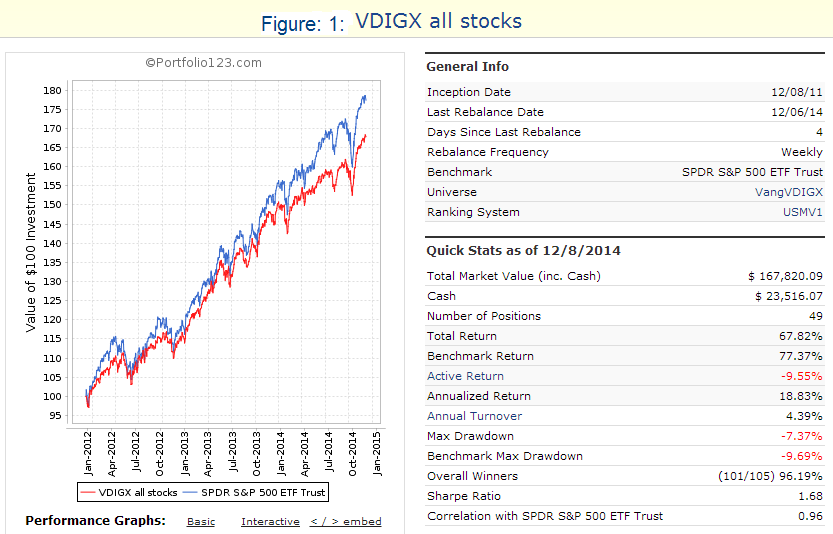
(A) All 49 stocks held continuously, approximately equal weighted over time.
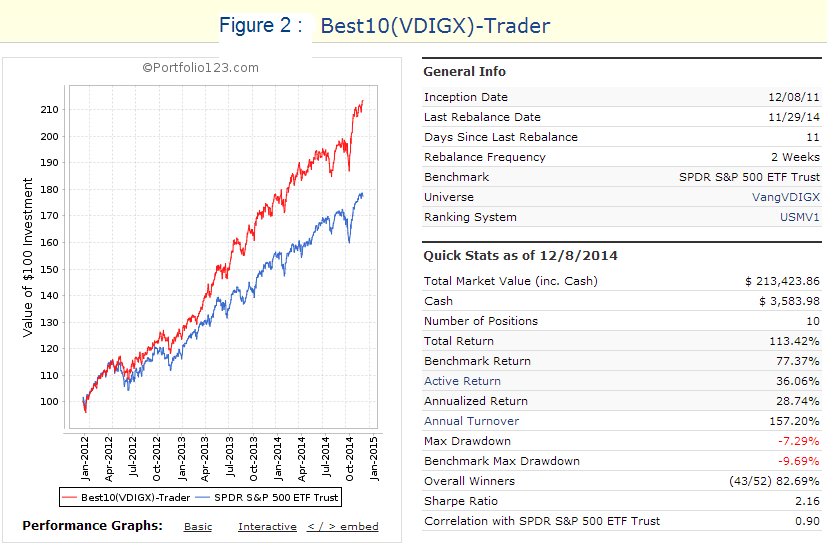
(B) Only 10 stocks periodically selected by a ranking system, with buy/sell rules.
The backtest results could be affected by survivorship bias, but due to the low 19% annual turnover of VDIGX it is believed that using the current holdings of the fund as the universe for the entire backtest period will not affect the simulated results significantly.
Results of backtest (A) with all the stocks of current holdings of VDIGX:
Had one on Dec-8-2011 invested equal weight in all the 49 stocks of the current holdings of VDIGX and applied the same 0.31% expense ratio as Vanguard does for this fund, then to Dec-8-2014 the total return over 3 years would have been 67.8%. Over the same period VDIGX gained 66.8%, effectively the same. The results confirm that using the current holdings for the entire backtest period is a legitimate technique when backtesting over shorter periods.
In the figures below the red graph represents the model and the blue graph shows the performance of benchmark SPY.

Results for backtest (B) with 10 selected stocks from VDIGX’s current holdings:
Had one on Dec-8-2011 invested equal weight in the 10 highest ranked stocks, rebalanced every 2 weeks and applied buy and sell rules, then over 3 years to Dec-8-2014 the total return would have been 113.4% and the annualized return (CAGR) would have been 28.7 %. Allowance was made for an expense ratio of 0.31% as for the fund.
This strategy would have provided much higher returns than Vanguard’s Dividend Growth Fund or SPY. Going forward, it will be a simple matter to update the Trader model periodically with the point-in-time holdings of VDIGX to eliminate any possible effect of survivorship bias.

Backtest Parameters
It is relatively simple to “overfit” an investment strategy so that it performs well in-sample, but the more complex a model is, the higher the likelihood of the out-of-sample performance to underperform the backtest’s results. Therefore a simple algorithm with only a few parameters was chosen for this model.
Ranking System:
- As for the Best12(USMV) model.
Buy Rules:
- As for the Best12(USMV) model – 3 rules, and
- percentage change of stock price over the last four weeks > -2.5%.
Sell Rules:
- Only 1 rule: Rank
Backtest Return from Jun-30-2014 to Dec-8-2014 for Best10(VDIGX)-Trader
This portfolio shows a 15.25% average return to 12/8/2014, while benchmark SPY gained only 6% over the same 161 day period. A starting capital of $100,000 at inception on 6/30/2014 would have grown to $115,245 which includes $631 cash with slippage of 0.1% of transaction costs accounted for.
The performance is not as good as that of the Best12(USMV)-Trader, but still considerably better than the performance of SPY or that of the Vanguard’s Dividend Growth Fund which gained 7.0% over this period.

Conclusion
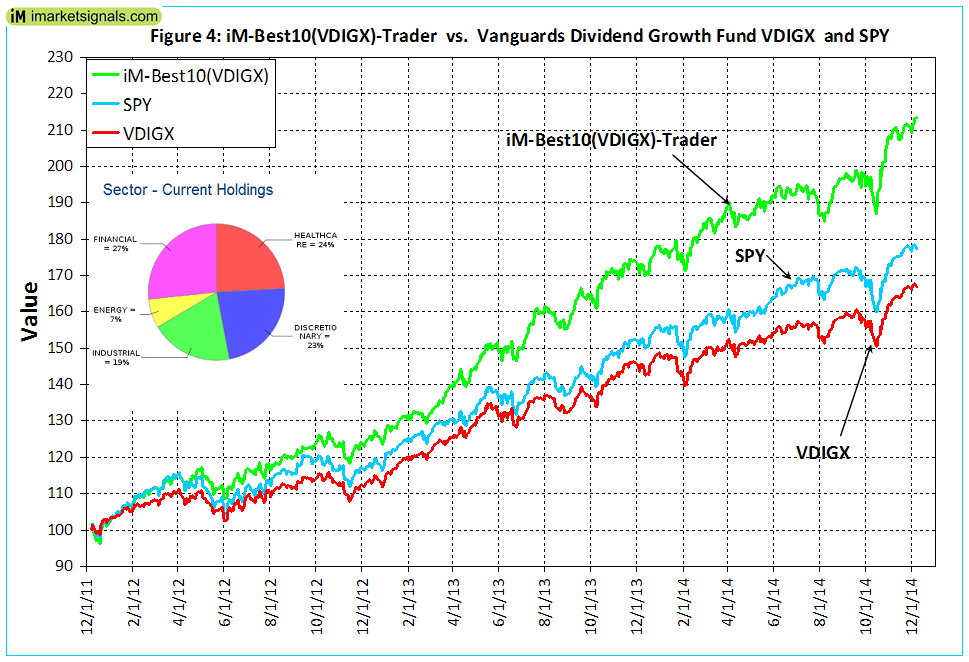
Using a ranking system to rank the stock holdings of VDIGX and only investing periodically in the 10 highest ranked stocks according to the buy/sell rules would have produced the best returns, as demonstrated by the results for backtests (B). The performance from Dec-2011 to Dec-2014 is shown in Figure-4 together with the sector allocation of current holdings. One can see that the model’s holdings are well diversified.

Which stock should you buy in your very next trade?
With valuations skyrocketing in 2024, many investors are uneasy putting more money into stocks. Unsure where to invest next? Get access to our proven portfolios and discover high-potential opportunities.
In 2024 alone, ProPicks AI identified 2 stocks that surged over 150%, 4 additional stocks that leaped over 30%, and 3 more that climbed over 25%. That's an impressive track record.
With portfolios tailored for Dow stocks, S&P stocks, Tech stocks, and Mid Cap stocks, you can explore various wealth-building strategies.
